
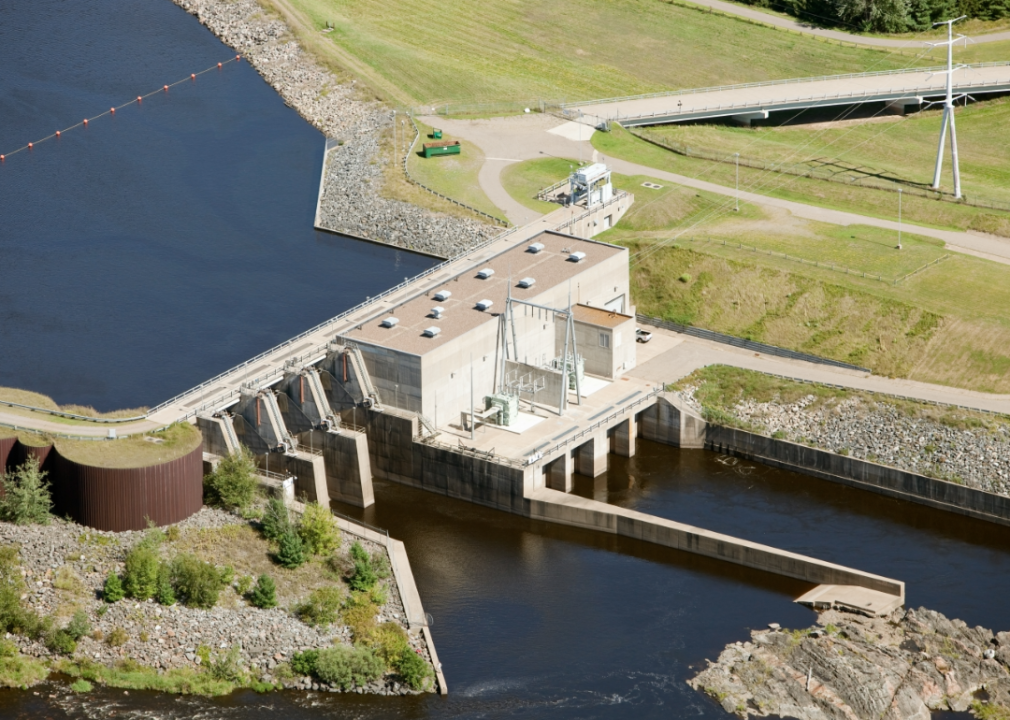
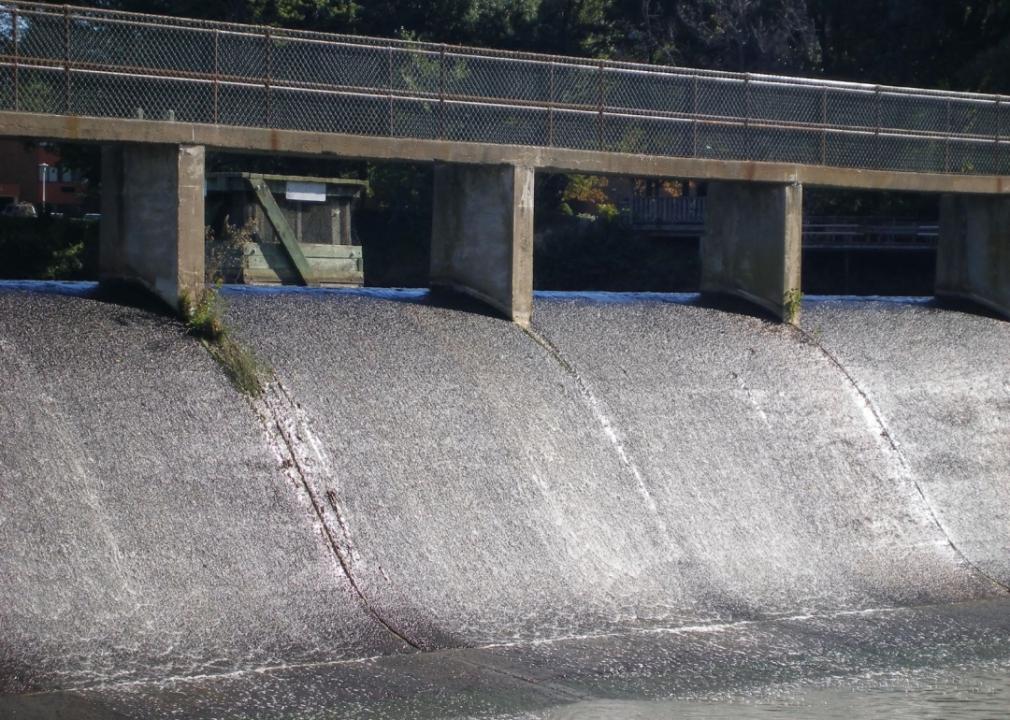
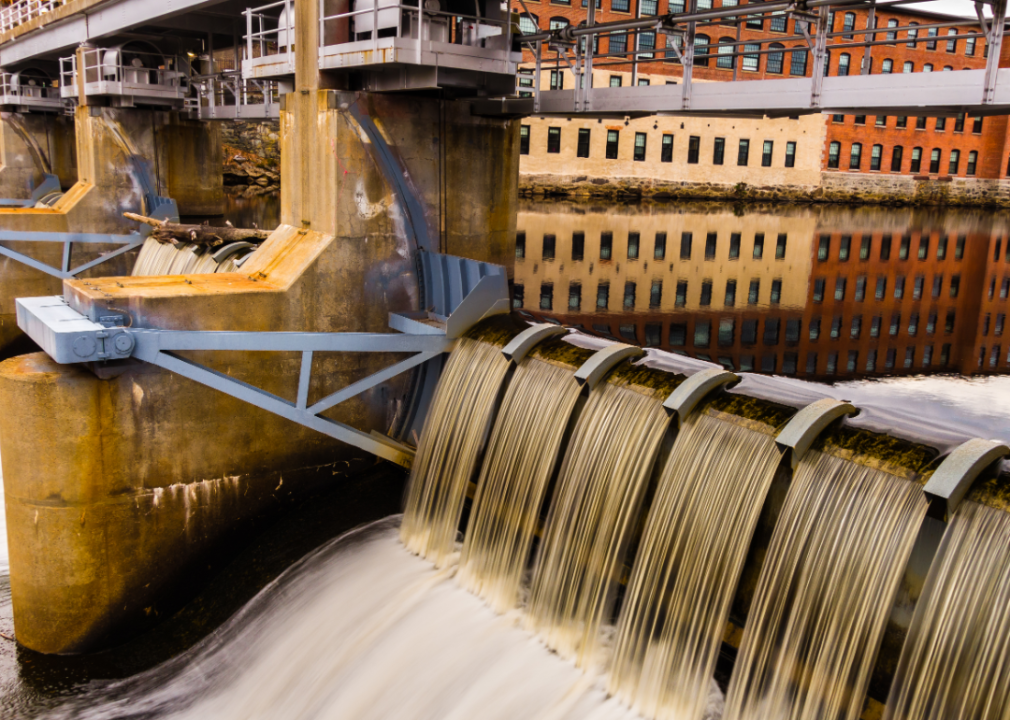
Record rainfall pelted parts of Iowa for 12 hours straight in July 2010, sending 10 inches of rainwater draining toward Lake Delhi, Iowa, a popular recreation destination for decades since its construction in the 1920s.
Holding back 9 miles of lake water with more precipitation flowing in by the minute was the 80-year-old Lake Delhi Dam, constructed of hundreds of feet of earth, concrete, and steel. The water punched a 30-foot-wide hole in the dam wall, spewing floodwater into the surrounding region.
Emergency and state officials ordered evacuations in time to prevent any loss of life. For safety professionals, the failure underscored the threat posed to dams by climate change (increasing the risk of flooding events), the importance of regular maintenance and inspection, and the impact of human errors in dam construction on dam integrity.
GetMyBoat analyzed data from the U.S. Army Corps of Engineers’ National Inventory of Dams to identify states with the most dams at risk of failure that pose the greatest potential threat to nearby residents. The public database allowing Americans to look up the conditions of nearby dams has grown to include more than 90,000 dams.
As more dams get added to the national inventory, analyses of this database reveal a growing number of dams in poor and unsatisfactory condition, some of which have the potential to be life-threatening should they fail—dams the inventory deems “high-hazard.”
States in this analysis ranked by the share of high-hazard dams that could pose a danger to human life, including those assessed to be in “poor” or “unsatisfactory” condition, those that haven’t received inspections, and those where the state agency that oversees them has not reported its conditions.
A designation of “poor” is given to inspected dams showing deficiencies that threaten the dam’s integrity during normal operations. “Unsatisfactory” is given to dams that require “immediate or emergency remedial action,” according to the Army Corps of Engineers. About 1 in 10 of the inventory’s dam listings have no condition reported by state agencies.
“It is likely most of these dams should be listed at Not Rated, but we will work with the appropriate agencies to verify the information and update the NID accordingly,” Army Corps of Engineers spokesperson Gene Pawlik said in a statement.
The names of dams accompanying each state in the analysis represent the largest dams by height that were in poor or unsatisfactory condition. The total number and concentration of high-hazard dams give a sense of the stakes involved with aging infrastructure in each state, though those figures don’t factor into the ranking.
The Lake Delhi Dam was reconstructed and was last inspected in 2020, receiving a “satisfactory” grade. The dam is considered one risk level below high-hazard, “significant hazard.” But its failure in 2010 provides an example of the high stakes communities living near large dams face when they fail.
Illinois ranks high on this list, mainly because of what is unknown about the conditions of its dams. The Army Corps of Engineers leaves it up to state agencies to decide what information it provides or withholds from the public database. Illinois only shares info on three of its dams deemed to be high-hazard. One of its engineers has previously said that it doesn’t rate dams’ conditions because the process is too resource-intensive to justify.
Many state and federal agencies have chosen to keep data about those damns hidden, citing threats to national security. North Dakota and Oregon withhold data about around 40% of the dams in their states, making it difficult for locals to assess just how many are in good condition or need attention.
Other states rank poorly for their share of high-hazard dams that have gone without inspection. In Missouri, about 42% of these dams don’t have a recorded date of last inspection. Another 24% were last inspected prior to 2000.
Read on to see how your state’s riskiest dams fare based on publicly available data.
![]()
Canva
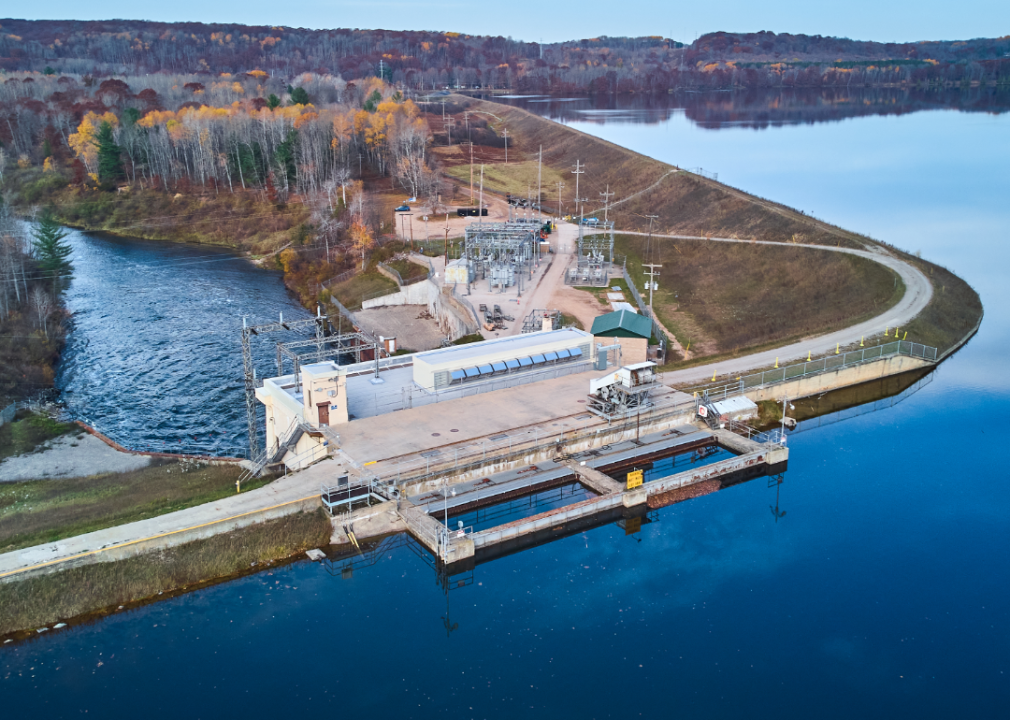
#50. Wisconsin
– Total high-hazard dams: 206 (3.5 per 100,000 residents)
– Share potentially dangerous: 8.7%
— Assessed to be an immediate threat: 1.5%
— Assessed to be in poor condition: 1.0%
— Condition withheld: 1.9%
— Not inspected: 4.4%
– Major examples (immediate threat): West Fork Kickapoo 1, Mlsna, Radigan
– Major examples (poor condition): Rock Falls, Rice
Canva
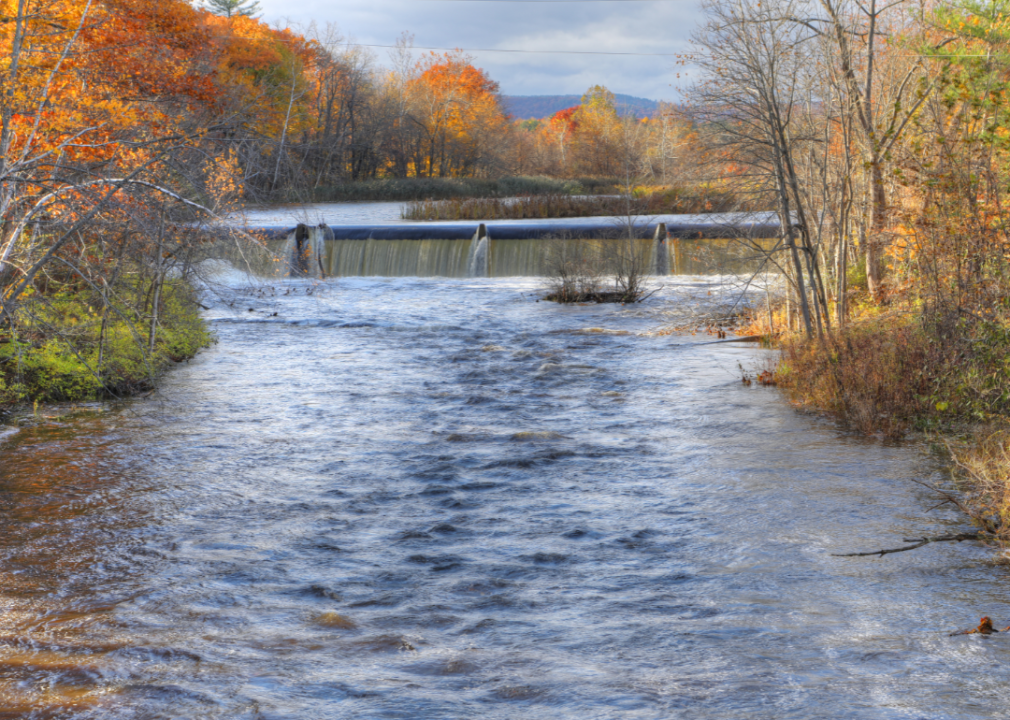
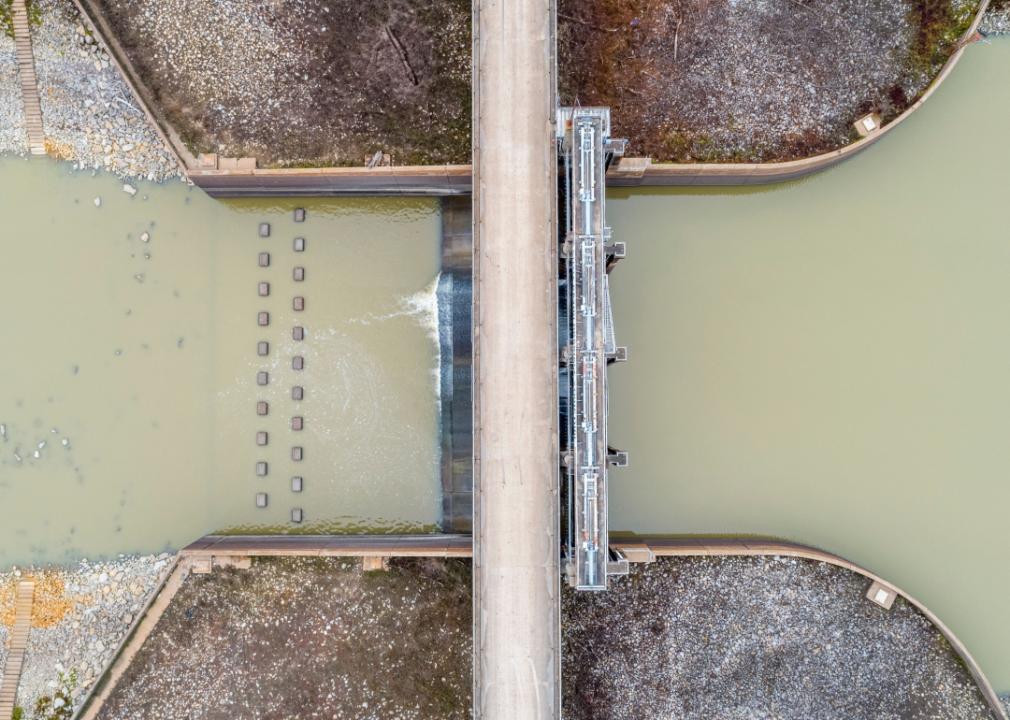
#49. Iowa
– Total high-hazard dams: 95 (3.0 per 100,000 residents)
– Share potentially dangerous: 11.6%
— Assessed to be an immediate threat: 0.0%
— Assessed to be in poor condition: 1.1%
— Condition withheld: 10.5%
— Not inspected: 0.0%
– Major examples (immediate threat): None
– Major examples (poor condition): Glen Oaks Country Club Dam
Canva
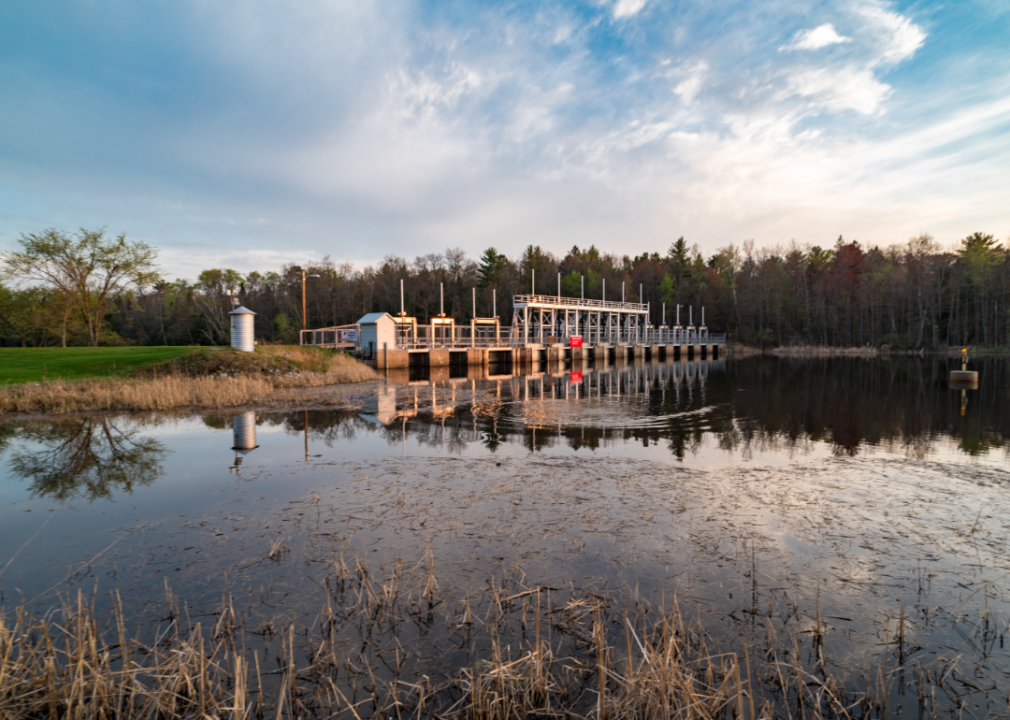
#48. Louisiana
– Total high-hazard dams: 41 (0.9 per 100,000 residents)
– Share potentially dangerous: 12.2%
— Assessed to be an immediate threat: 0.0%
— Assessed to be in poor condition: 4.9%
— Condition withheld: 4.9%
— Not inspected: 2.4%
– Major examples (immediate threat): None
– Major examples (poor condition): Kincaid Reservoir, Longville Lake
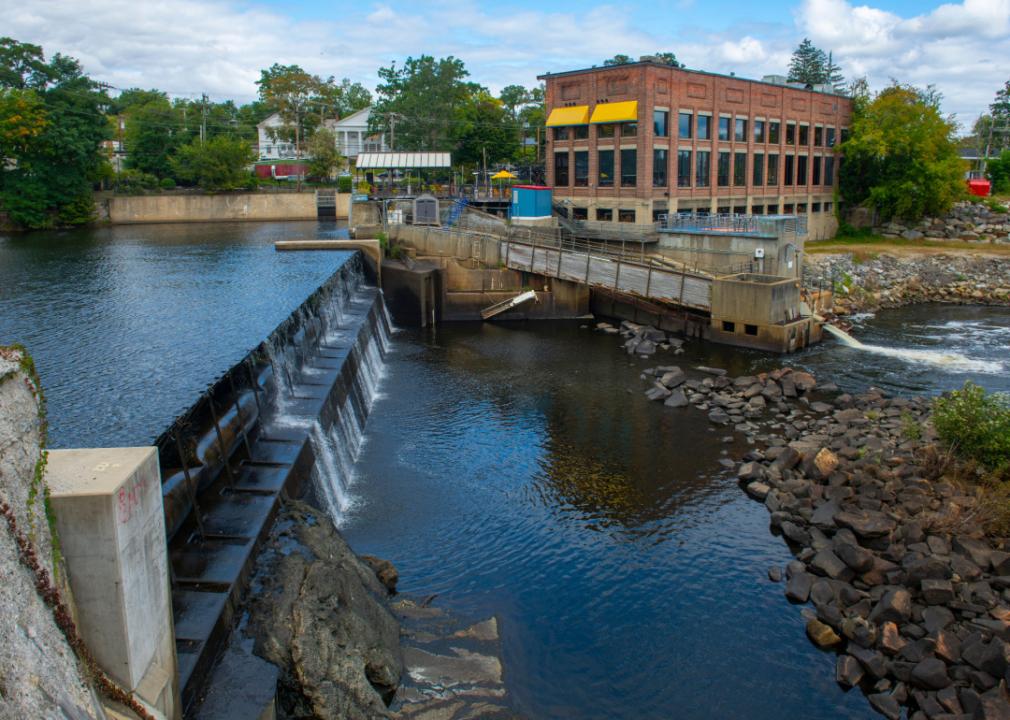
Denis Morin // Shutterstock
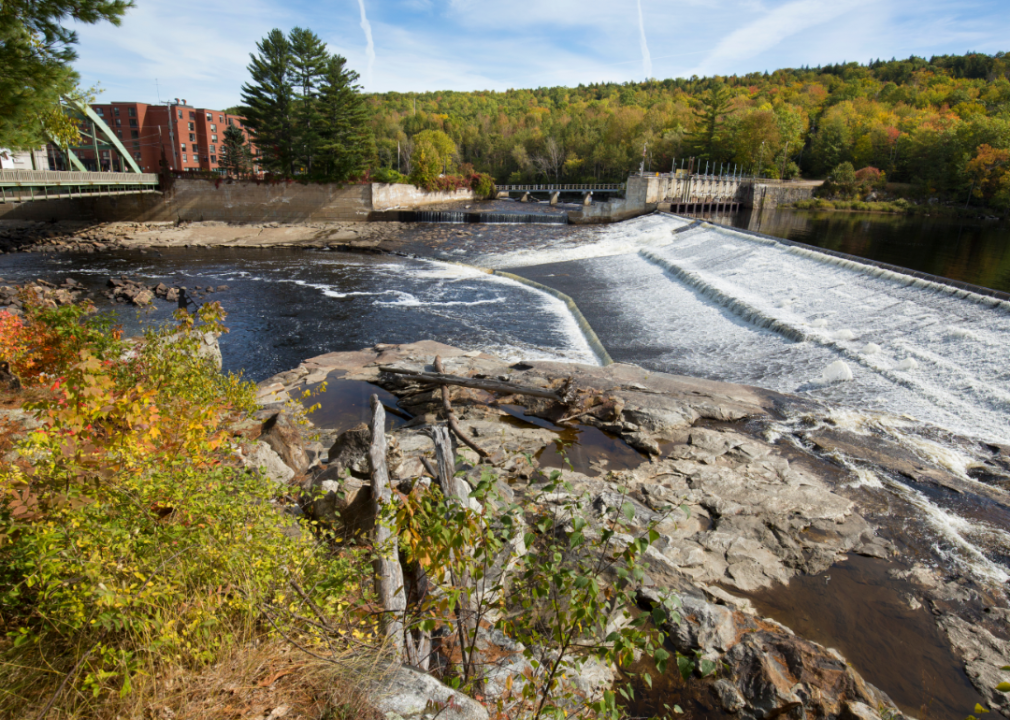
#47. Connecticut
– Total high-hazard dams: 274 (7.6 per 100,000 residents)
– Share potentially dangerous: 14.6%
— Assessed to be an immediate threat: 0.0%
— Assessed to be in poor condition: 7.3%
— Condition withheld: 5.8%
— Not inspected: 1.5%
– Major examples (immediate threat): None
– Major examples (poor condition): Crystal Lake Dam, Hartford Reservoir #1 Dam, Peat Swamp Reservoir Dam, Great Hill Reservior Dam
Canva
#46. Michigan
– Total high-hazard dams: 162 (1.6 per 100,000 residents)
– Share potentially dangerous: 15.4%
— Assessed to be an immediate threat: 2.5%
— Assessed to be in poor condition: 6.8%
— Condition withheld: 1.2%
— Not inspected: 4.9%
– Major examples (immediate threat): Secord Dam, Edenville Dam, Smallwood Dam, Sanford Dam
– Major examples (poor condition): Cornwall Creek Dam, Little Black River Structure B, Trowbridge Dam, Manistique Papers Dam
Canva
#45. Massachusetts
– Total high-hazard dams: 329 (4.7 per 100,000 residents)
– Share potentially dangerous: 16.1%
— Assessed to be an immediate threat: 2.1%
— Assessed to be in poor condition: 7.3%
— Condition withheld: 6.4%
— Not inspected: 0.3%
– Major examples (immediate threat): Bel Air Dam, Bird Pond Dam, Moulton Pond Dam, Tremont Mill Pond
– Major examples (poor condition): Notch Reservoir Dam, Haskell Pond Dam, Mount Williams Reservoir Dam, Damon Pond Dam
Canva
#44. Minnesota
– Total high-hazard dams: 55 (1.0 per 100,000 residents)
– Share potentially dangerous: 18.2%
— Assessed to be an immediate threat: 0.0%
— Assessed to be in poor condition: 3.6%
— Condition withheld: 9.1%
— Not inspected: 5.5%
– Major examples (immediate threat): None
– Major examples (poor condition): Lake Bronson, Pelican Rapids
Canva
#43. Maine
– Total high-hazard dams: 73 (5.3 per 100,000 residents)
– Share potentially dangerous: 19.2%
— Assessed to be an immediate threat: 6.8%
— Assessed to be in poor condition: 12.3%
— Condition withheld: 0.0%
— Not inspected: 0.0%
– Major examples (immediate threat): Grand Falls, Josephine, Silver Lake, Lake Auburn
– Major examples (poor condition): Woodland, Christina, Emery Mills, Grand Lake (Matagamon)
Teresa Levite // Shutterstock
#42. Delaware
– Total high-hazard dams: 57 (5.6 per 100,000 residents)
– Share potentially dangerous: 19.3%
— Assessed to be an immediate threat: 0.0%
— Assessed to be in poor condition: 5.3%
— Condition withheld: 0.0%
— Not inspected: 14.0%
– Major examples (immediate threat): None
– Major examples (poor condition): Millsboro Pond Dam, Shoals Branch Dam, Burton Pond Dam

Mihai_Andritoiu // Shutterstock
#41. New Jersey
– Total high-hazard dams: 232 (2.5 per 100,000 residents)
– Share potentially dangerous: 20.3%
— Assessed to be an immediate threat: 0.0%
— Assessed to be in poor condition: 20.3%
— Condition withheld: 0.0%
— Not inspected: 0.0%
– Major examples (immediate threat): None
– Major examples (poor condition): Round Valley South Dam, Round Valley North Dam, Spruce Run Reservoir Dam, Round Valley Dike
2265524729 // Shutterstocck
#40. Virginia
– Total high-hazard dams: 429 (4.9 per 100,000 residents)
– Share potentially dangerous: 22.6%
— Assessed to be an immediate threat: 1.9%
— Assessed to be in poor condition: 10.0%
— Condition withheld: 3.0%
— Not inspected: 7.7%
– Major examples (immediate threat): Lake Monroe Dam, South River Dam #19, Lake Arrowhead Dam, Killarney Dam
– Major examples (poor condition): Beaverdam Creek Dam, Little Creek Dam, Lunga Dam, Breckinridge Dam
venuswix // Shutterstock
#38. Utah
– Total high-hazard dams: 266 (7.9 per 100,000 residents)
– Share potentially dangerous: 23.3%
— Assessed to be an immediate threat: 0.0%
— Assessed to be in poor condition: 4.1%
— Condition withheld: 19.2%
— Not inspected: 0.0%
– Major examples (immediate threat): None
– Major examples (poor condition): Tony Grove Lake Dam, Alton Reservoir, Palisades Lake, Red Pine
Canva
#38. Alaska
– Total high-hazard dams: 30 (4.1 per 100,000 residents)
– Share potentially dangerous: 23.3%
— Assessed to be an immediate threat: 0.0%
— Assessed to be in poor condition: 13.3%
— Condition withheld: 6.7%
— Not inspected: 3.3%
– Major examples (immediate threat): None
– Major examples (poor condition): Wrangell Lower, Wrangell Upper, Alitak Cannery Dam #1, Explorer Glacier Pond Dam
Canva
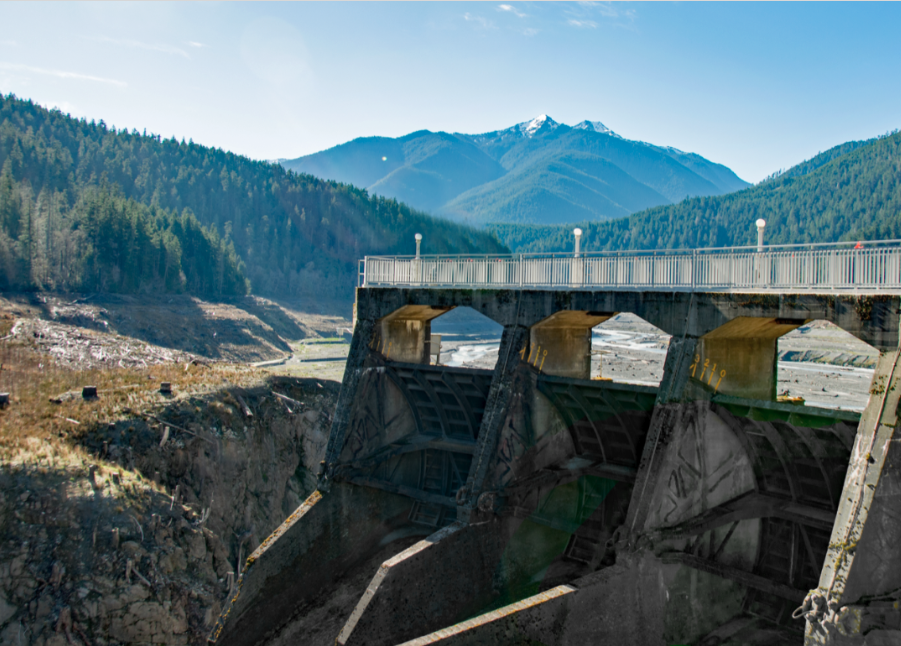
#37. Washington
– Total high-hazard dams: 320 (4.1 per 100,000 residents)
– Share potentially dangerous: 23.4%
— Assessed to be an immediate threat: 1.3%
— Assessed to be in poor condition: 11.3%
— Condition withheld: 10.0%
— Not inspected: 0.9%
– Major examples (immediate threat): Mossyrock, Mayfield, Yale Saddle Dam, Yelm Canal Dike
– Major examples (poor condition): Lower Baker, Wells, Priest Rapids, Upriver Dam
Canva
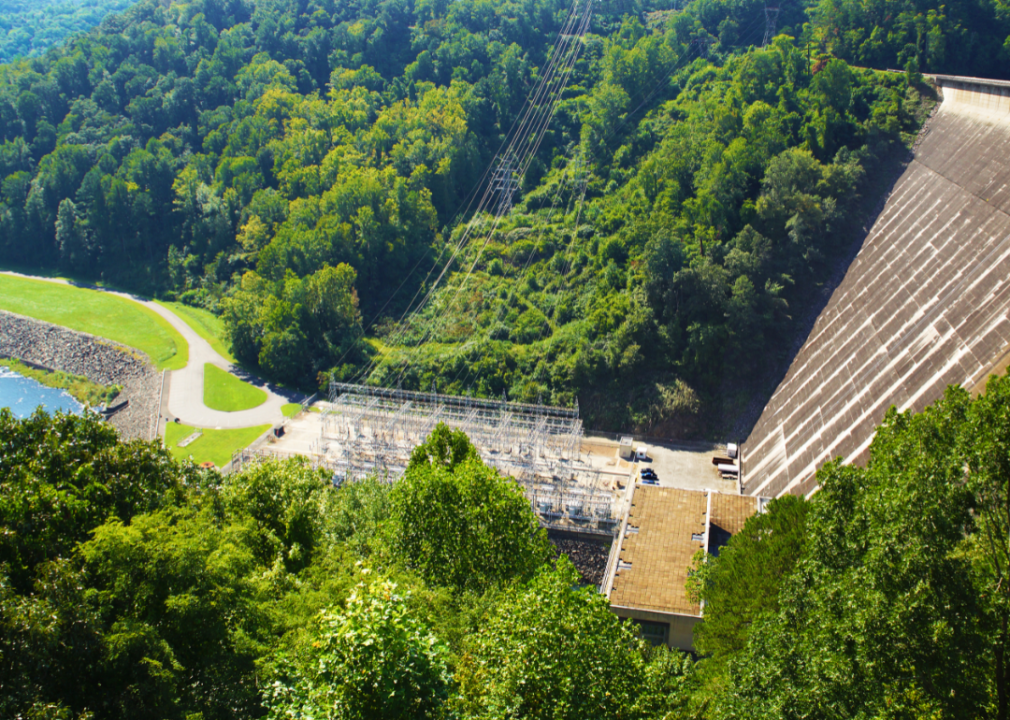
#36. North Carolina
– Total high-hazard dams: 1533 (14.3 per 100,000 residents)
– Share potentially dangerous: 24.3%
— Assessed to be an immediate threat: 2.9%
— Assessed to be in poor condition: 10.2%
— Condition withheld: 1.2%
— Not inspected: 9.8%
– Major examples (immediate threat): Simmons Fields Lake, Young’S Lake, Mcfayden Lake, Hutaff Lake
– Major examples (poor condition): Santeetlah, Yadkin Narrows Bypass Spillway Control Structure, Mott Lake, Lake Lindsay
Canva
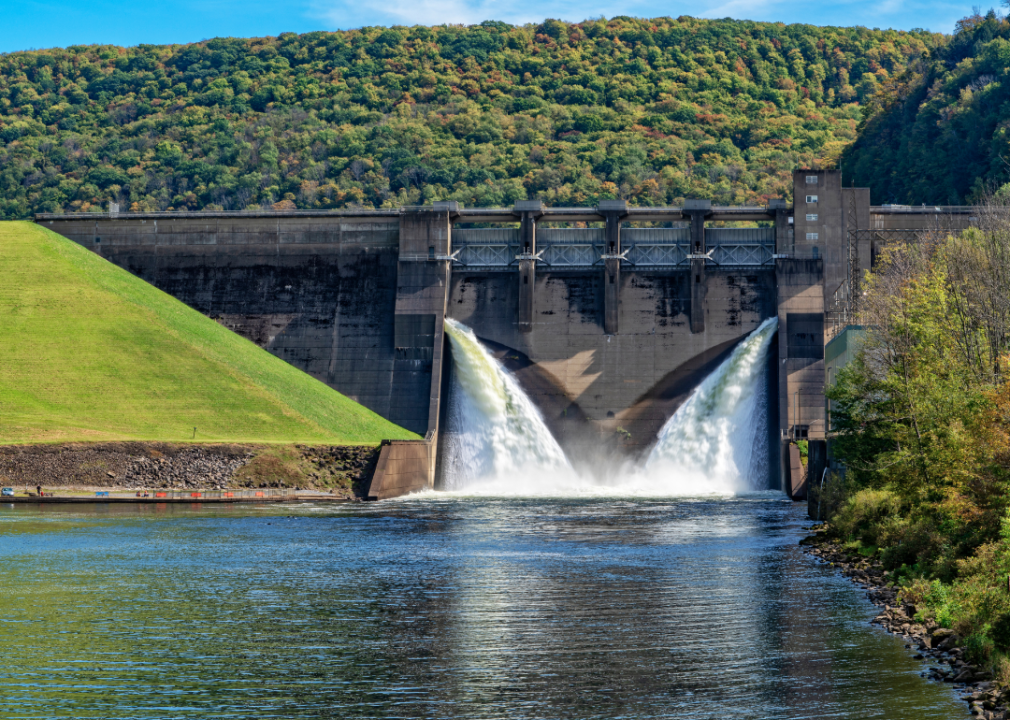
#35. Pennsylvania
– Total high-hazard dams: 788 (6.1 per 100,000 residents)
– Share potentially dangerous: 24.4%
— Assessed to be an immediate threat: 1.4%
— Assessed to be in poor condition: 17.0%
— Condition withheld: 5.3%
— Not inspected: 0.6%
– Major examples (immediate threat): Ryerson Station, Indian Run, Upper Castanea Reservoir, Bernhart
– Major examples (poor condition): Little Pine Creek, Dehart, North Fork, Mill Run
Canva
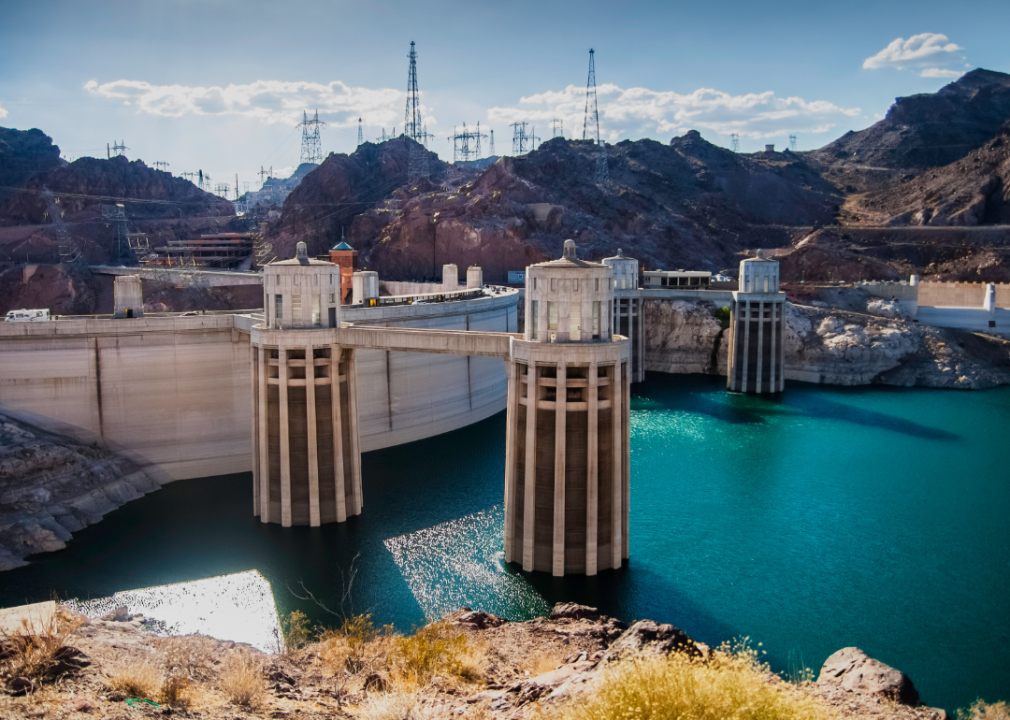
#34. Nevada
– Total high-hazard dams: 158 (5.0 per 100,000 residents)
– Share potentially dangerous: 24.7%
— Assessed to be an immediate threat: 2.5%
— Assessed to be in poor condition: 15.8%
— Condition withheld: 4.4%
— Not inspected: 1.9%
– Major examples (immediate threat): Cat Creek , Bishop Creek Dam, Sierra Sage Ponds Dam , Home Ranch Canyon Dam
– Major examples (poor condition): Cave Creek Dam, Eagle Valley Reservoir Dam, Eldorado Canyon Dam, Las Vegas Wash Upper Detention Basin Dam
Canva
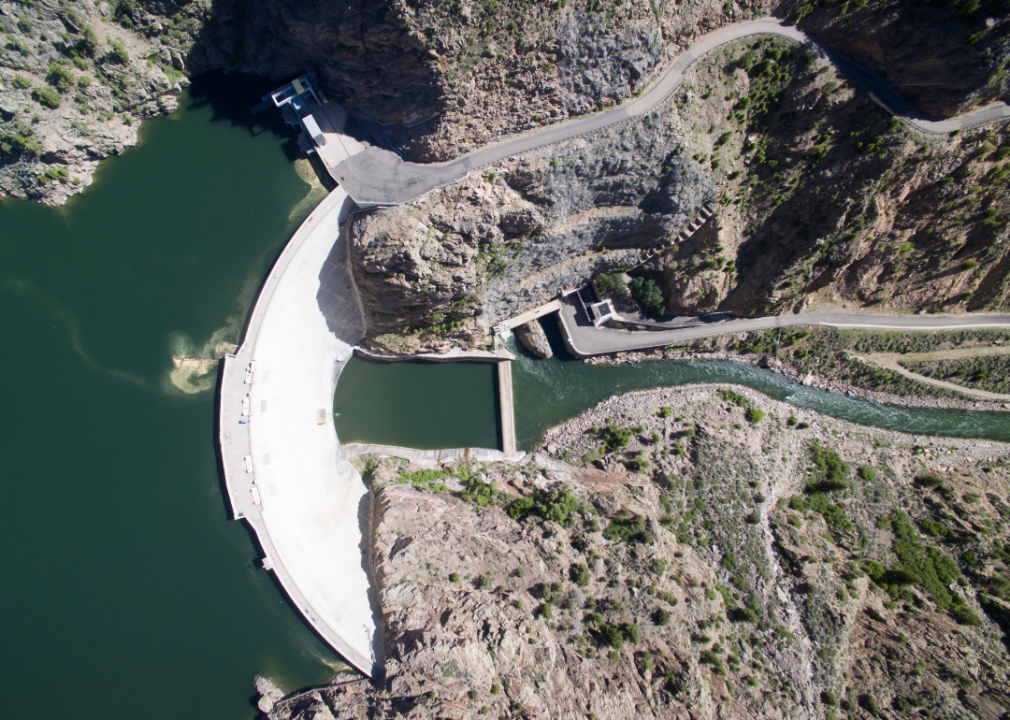
#33. Colorado
– Total high-hazard dams: 472 (8.1 per 100,000 residents)
– Share potentially dangerous: 25.2%
— Assessed to be an immediate threat: 7.8%
— Assessed to be in poor condition: 0.2%
— Condition withheld: 14.2%
— Not inspected: 3.0%
– Major examples (immediate threat): Sanchez, Narraguinnep – Main Dam, Miramonte, Stillwater #1
– Major examples (poor condition): Trout Lake
Canva
#32. South Carolina
– Total high-hazard dams: 668 (12.6 per 100,000 residents)
– Share potentially dangerous: 25.6%
— Assessed to be an immediate threat: 2.1%
— Assessed to be in poor condition: 19.5%
— Condition withheld: 1.3%
— Not inspected: 2.7%
– Major examples (immediate threat): Caldwell Lake Dam, Weston Lake, Arcadia Woods Lake Dam, Whisperlake Dam
– Major examples (poor condition): Chattooga Lake Dam, Lake Lanier Dam, Silver Lake Dam, Finleys Lake Dam
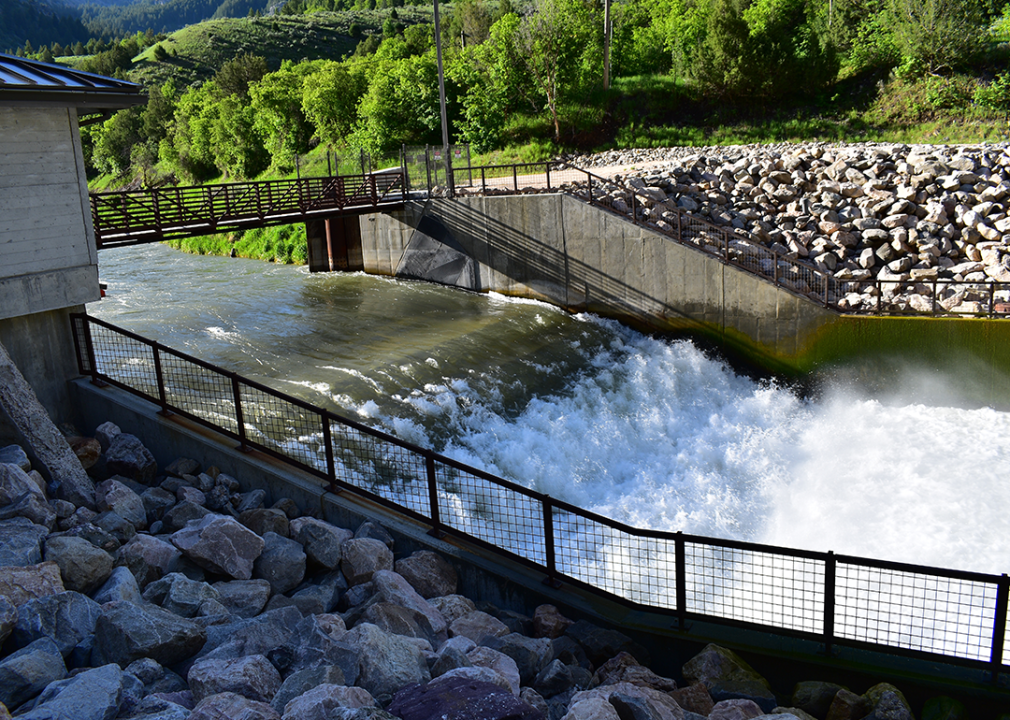
Canva
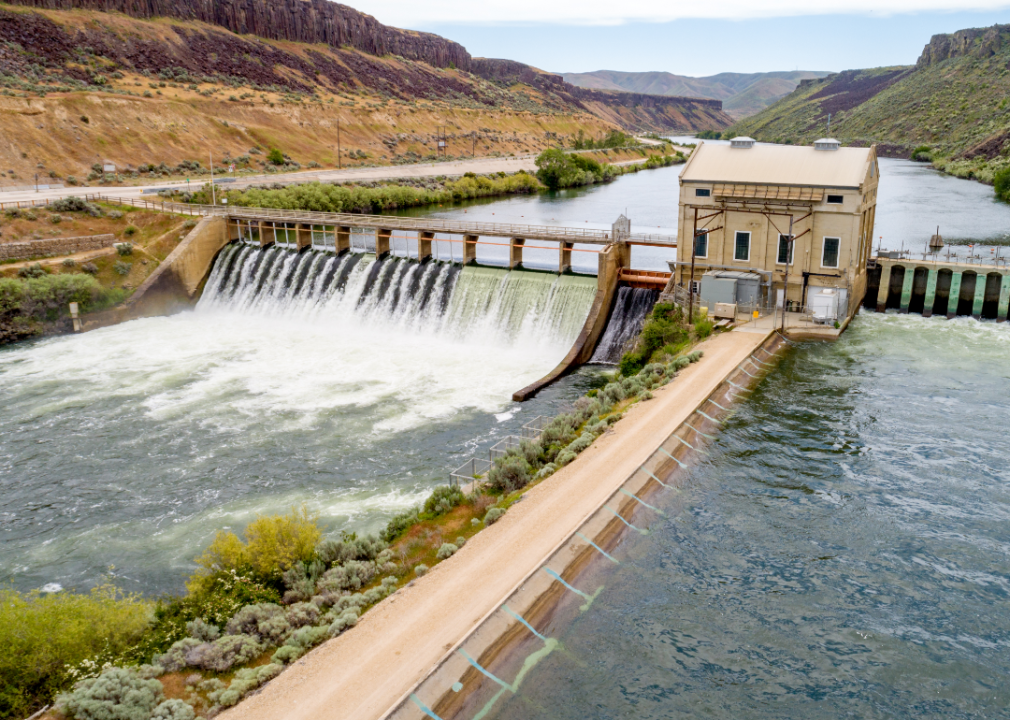
#31. Idaho
– Total high-hazard dams: 107 (5.5 per 100,000 residents)
– Share potentially dangerous: 26.2%
— Assessed to be an immediate threat: 0.9%
— Assessed to be in poor condition: 1.9%
— Condition withheld: 23.4%
— Not inspected: 0.0%
– Major examples (immediate threat): Saint John
– Major examples (poor condition): Fish Creek, Lost Valley
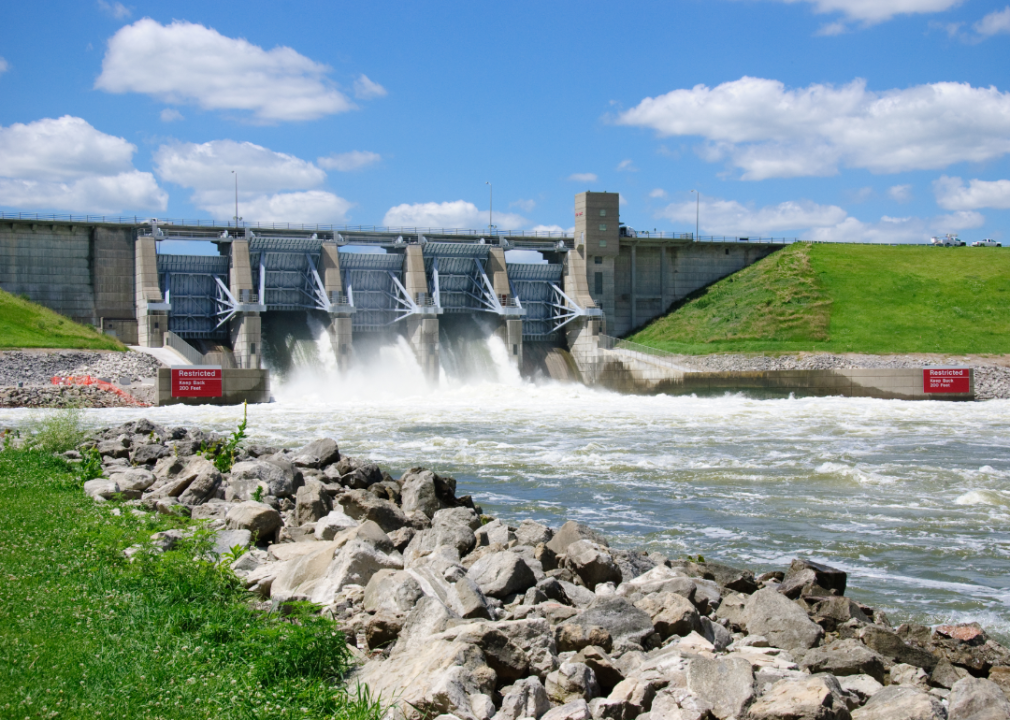
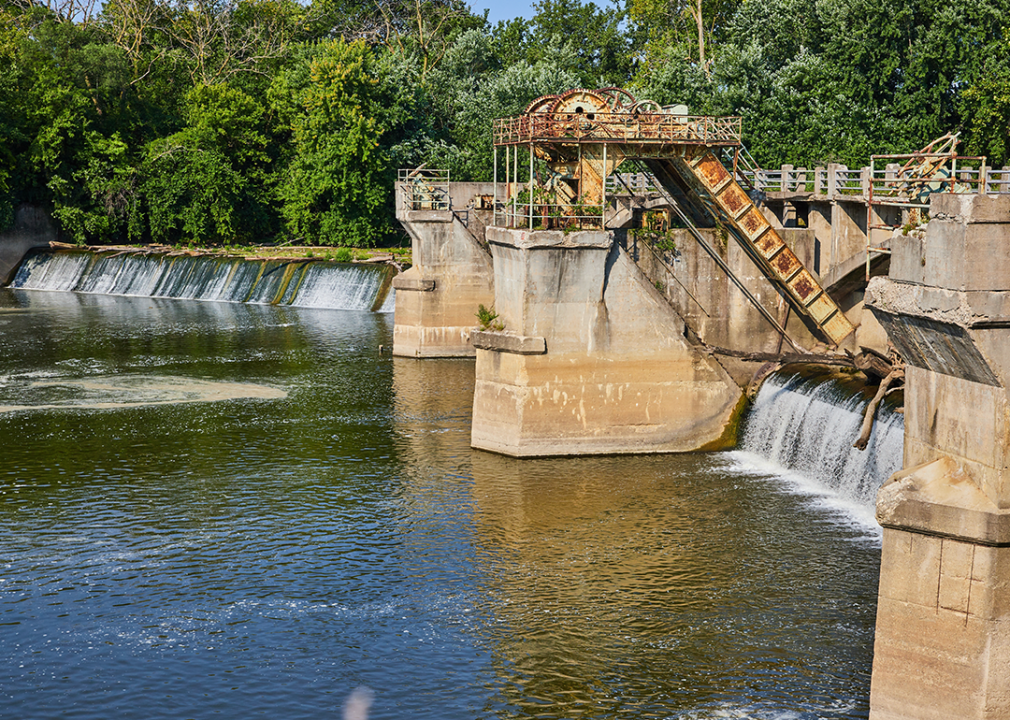
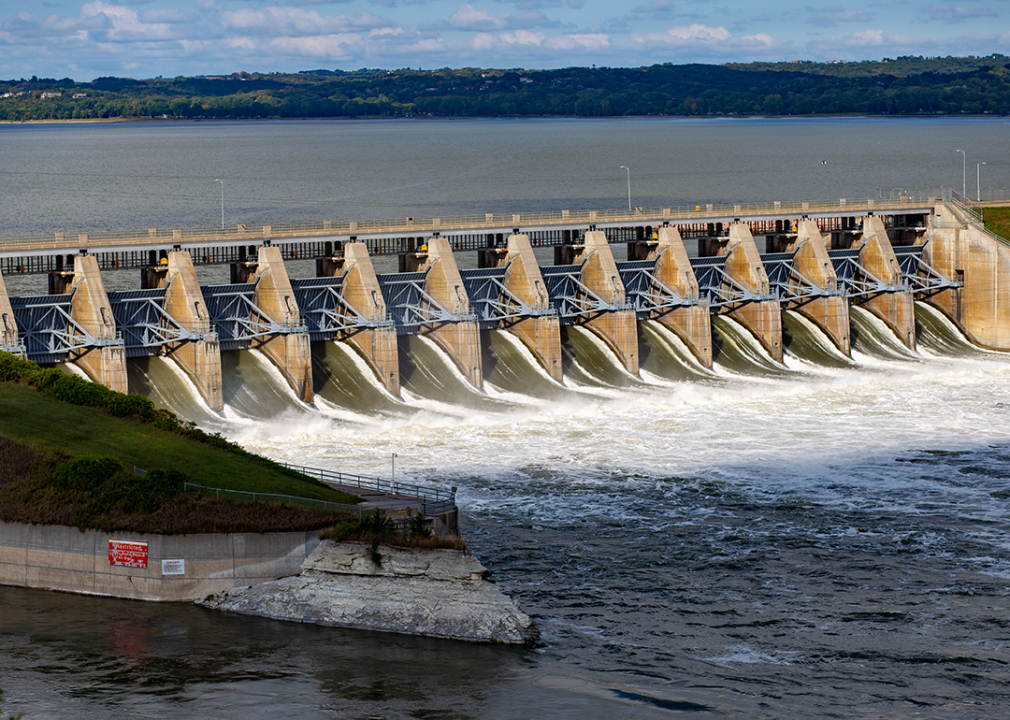
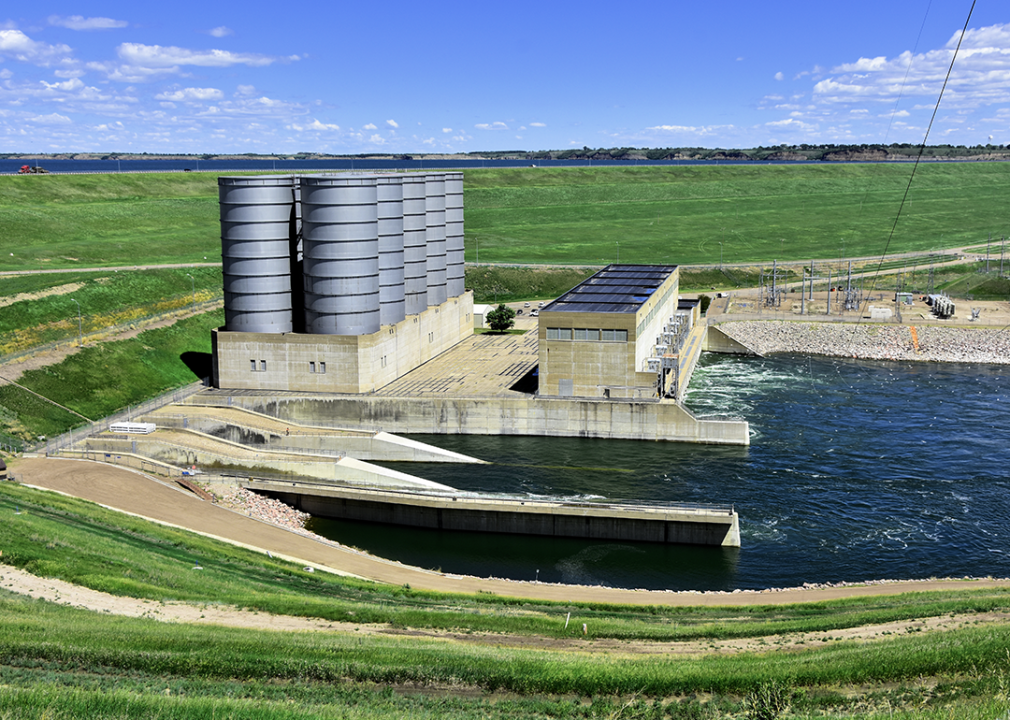
Hawk Eye Drone // Shutterstock
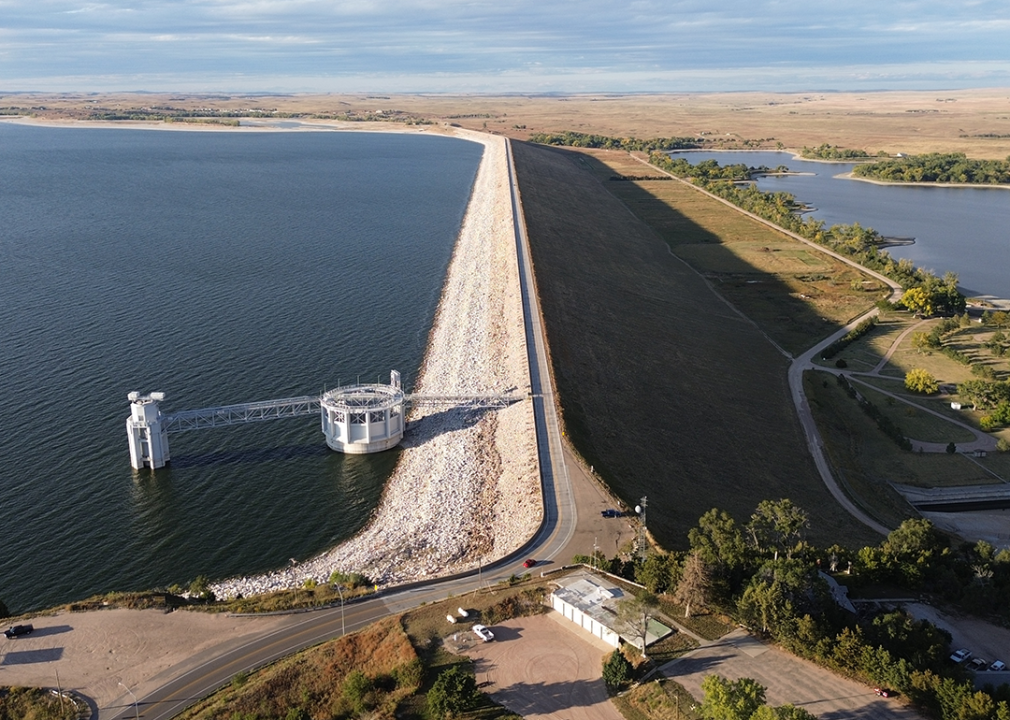
#30. Nebraska
– Total high-hazard dams: 151 (7.7 per 100,000 residents)
– Share potentially dangerous: 27.2%
— Assessed to be an immediate threat: 0.0%
— Assessed to be in poor condition: 7.3%
— Condition withheld: 18.5%
— Not inspected: 1.3%
– Major examples (immediate threat): None
– Major examples (poor condition): Beaver Lake Dam, Gering Valley B, Willow Creek Dam, Spring Creek 19-B
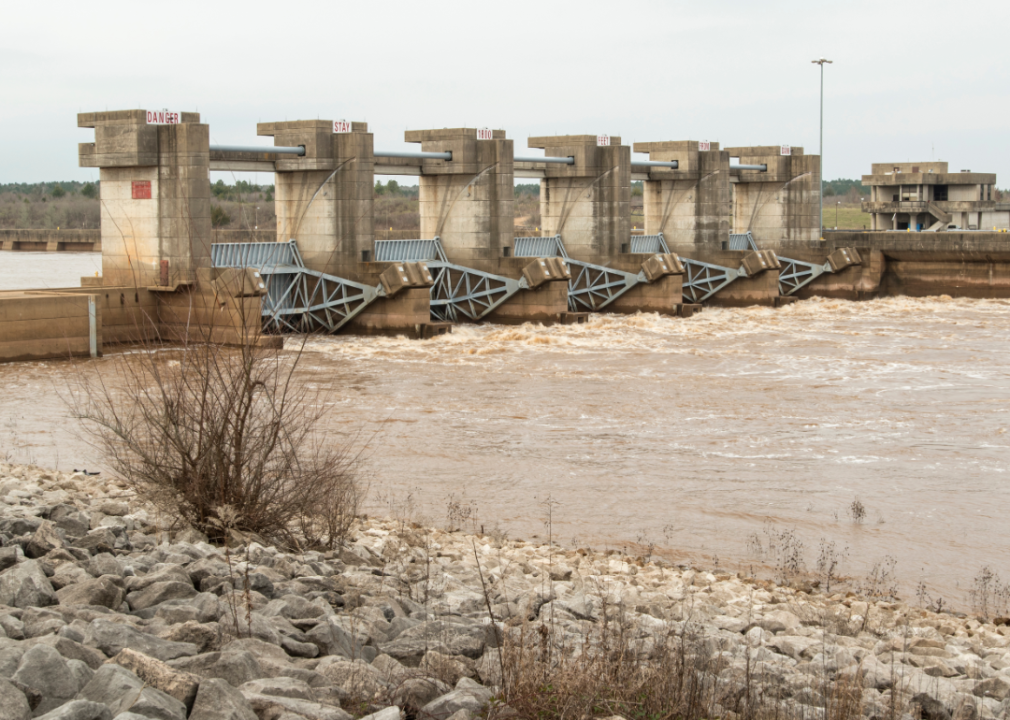
Kit Leong // Shutterstock
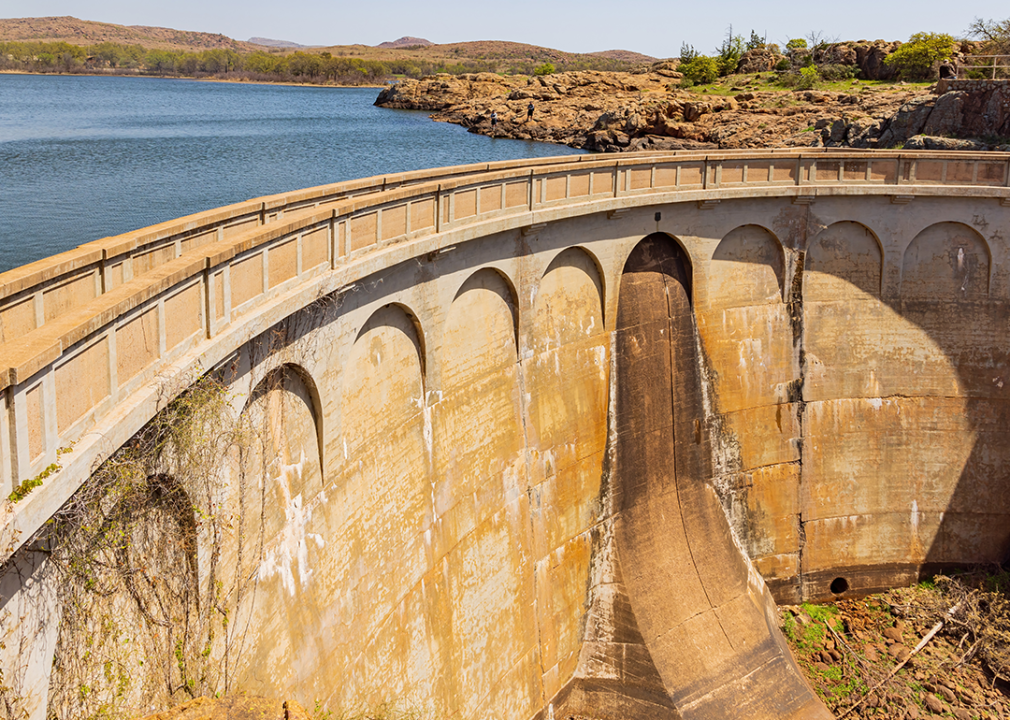
#29. Oklahoma
– Total high-hazard dams: 449 (11.2 per 100,000 residents)
– Share potentially dangerous: 28.5%
— Assessed to be an immediate threat: 2.2%
— Assessed to be in poor condition: 6.5%
— Condition withheld: 12.5%
— Not inspected: 7.3%
– Major examples (immediate threat): Lake Ellsworth, Robert S. Kerr, Hominy Lake, Waxhoma Lake
– Major examples (poor condition): Chimney Rock Pump Storage, Lake Carl Blackwell, Okmulgee Lake, Shell Creek Lake Dam
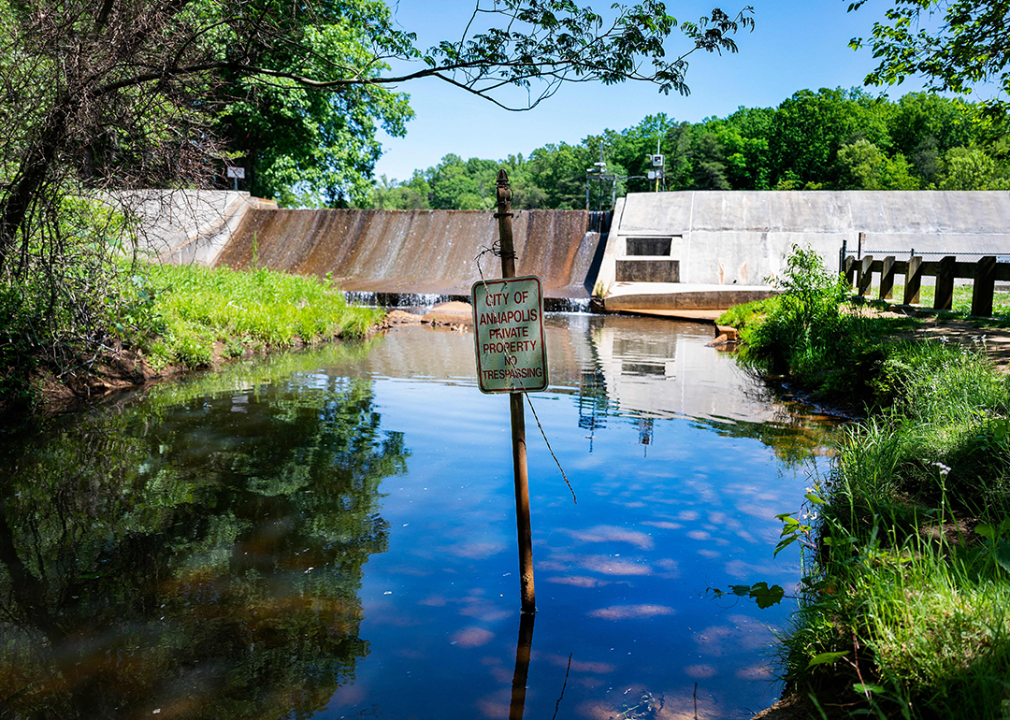
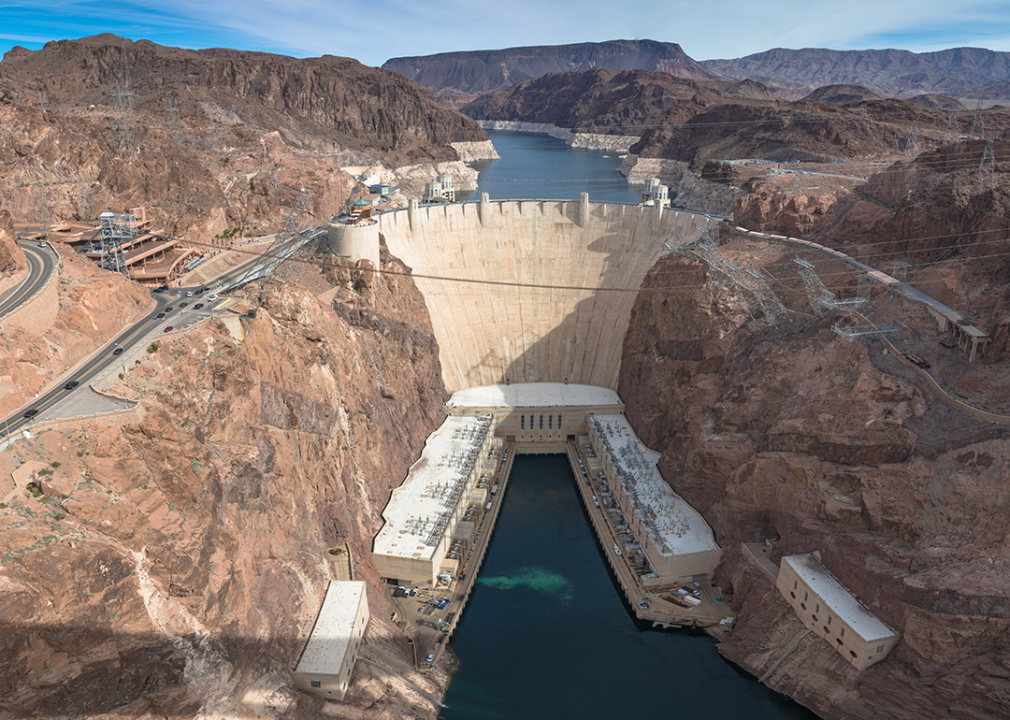
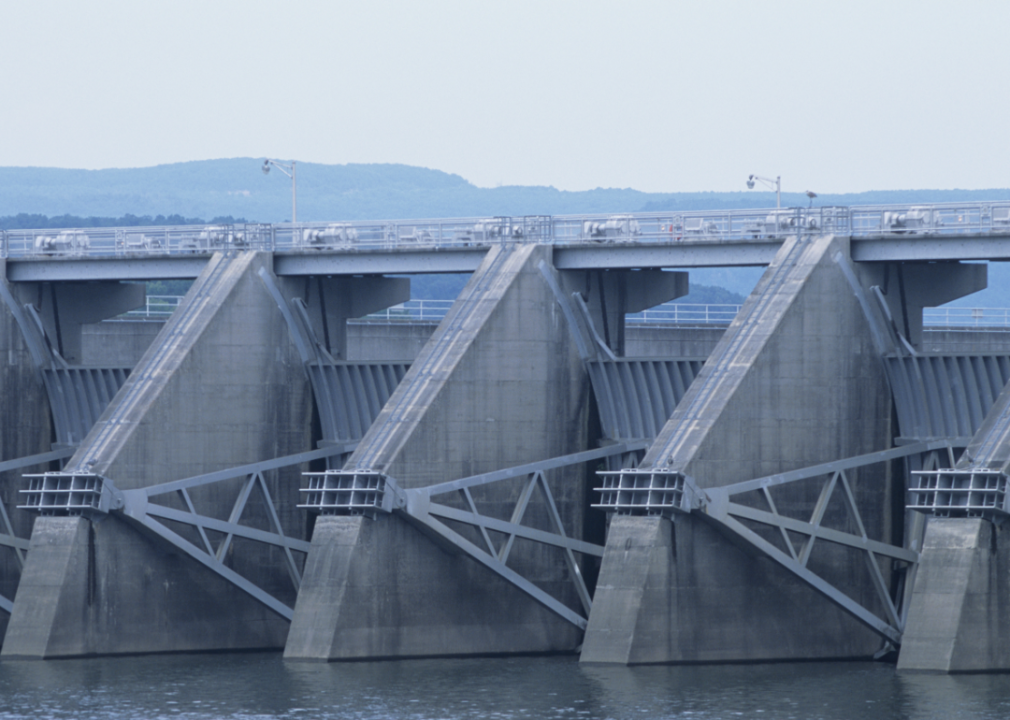
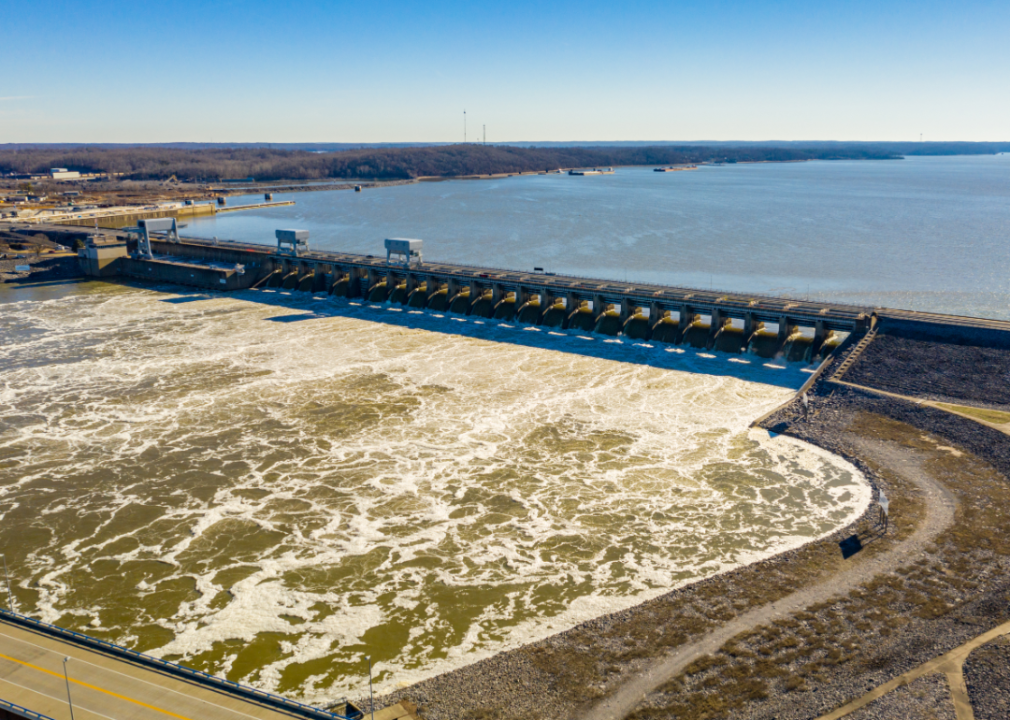
JIM WATSON/AFP via Getty Images
#28. Maryland
– Total high-hazard dams: 101 (1.6 per 100,000 residents)
– Share potentially dangerous: 29.7%
— Assessed to be an immediate threat: 9.9%
— Assessed to be in poor condition: 18.8%
— Condition withheld: 1.0%
— Not inspected: 0.0%
– Major examples (immediate threat): Liberty Dam, Piney Run Dam, Warner Gap Hollow Dam, Greenbrier State Park Dam & Dike
– Major examples (poor condition): Druid Hill Lake Reservoir and Storage Tanks, Frostburg Reservoir, New Bald Eagle Road Swm, Woodlawn Railroad Embankment On Basin Run
Picunique // Shutterstock
#27. Kansas
– Total high-hazard dams: 323 (11.0 per 100,000 residents)
– Share potentially dangerous: 31.3%
— Assessed to be an immediate threat: 0.6%
— Assessed to be in poor condition: 8.4%
— Condition withheld: 9.3%
— Not inspected: 13.0%
– Major examples (immediate threat): Rogers Dam, Willow Lake
– Major examples (poor condition): Lake Dabinawa, Lake Estates West, Bayer Pond Dam, Frd No T-4
Unwind // Shutterstock
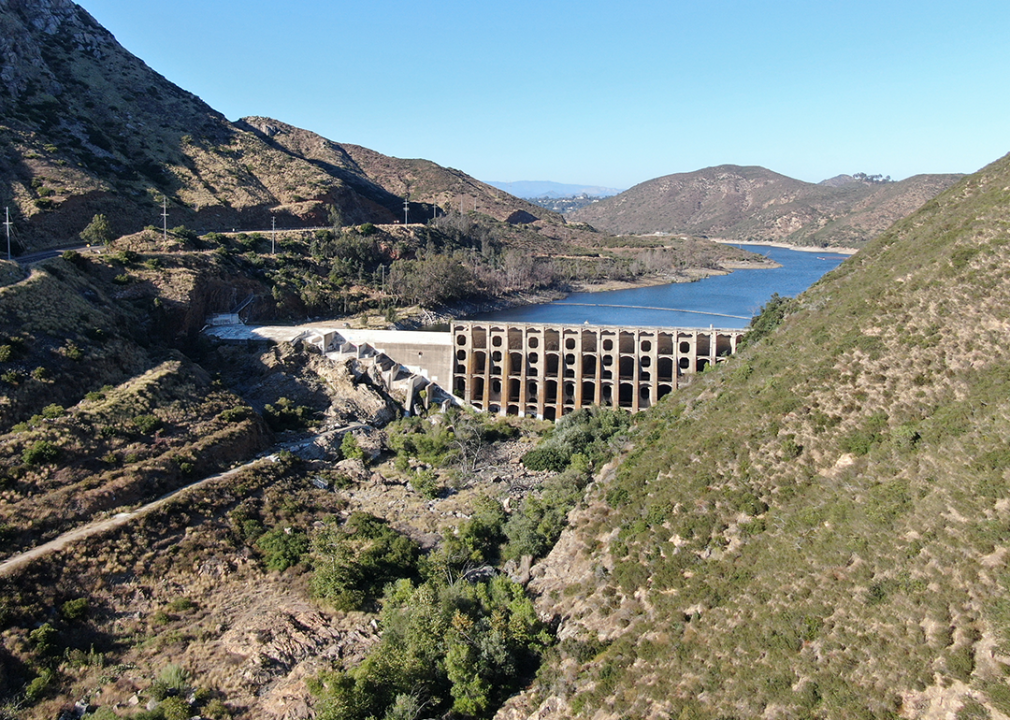
#26. California
– Total high-hazard dams: 867 (2.2 per 100,000 residents)
– Share potentially dangerous: 32.6%
— Assessed to be an immediate threat: 0.2%
— Assessed to be in poor condition: 2.2%
— Condition withheld: 29.4%
— Not inspected: 0.8%
– Major examples (immediate threat): Lake Hodges, Double U Fish Ranch
– Major examples (poor condition): Castaic, El Capitan, Morena, Matilija
Jon Bilous // Shutterstock
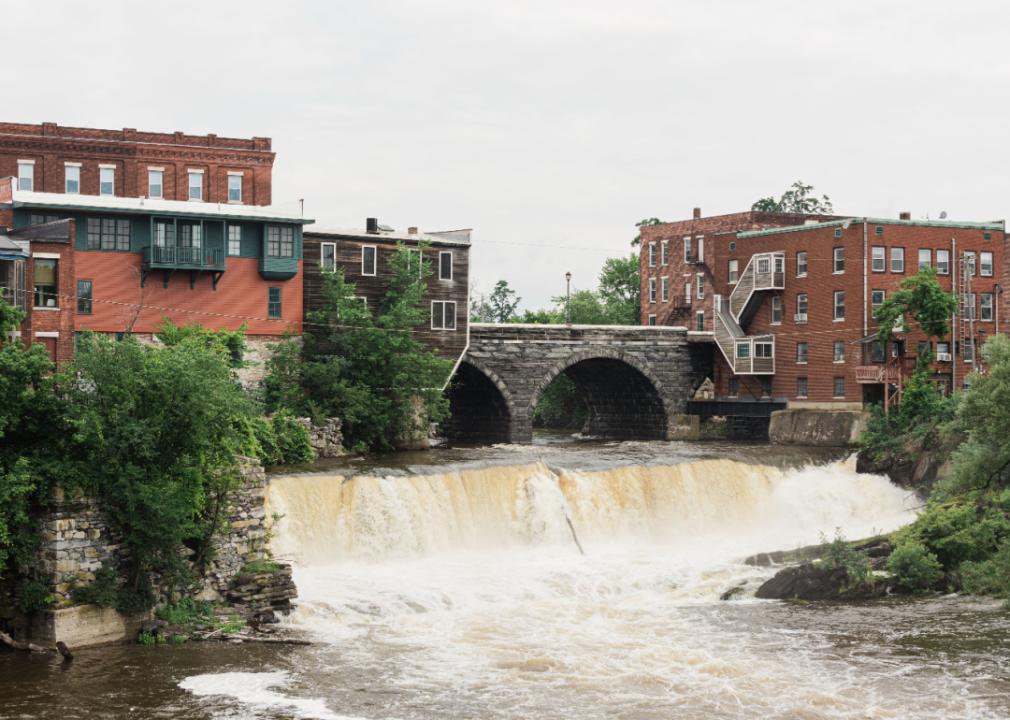
#25. Vermont
– Total high-hazard dams: 62 (9.6 per 100,000 residents)
– Share potentially dangerous: 33.9%
— Assessed to be an immediate threat: 0.0%
— Assessed to be in poor condition: 16.1%
— Condition withheld: 9.7%
— Not inspected: 8.1%
– Major examples (immediate threat): None
– Major examples (poor condition): Waterbury, Sugar Hill, Windsor Upper, Institute Pond
yuriyt // Shutterstock
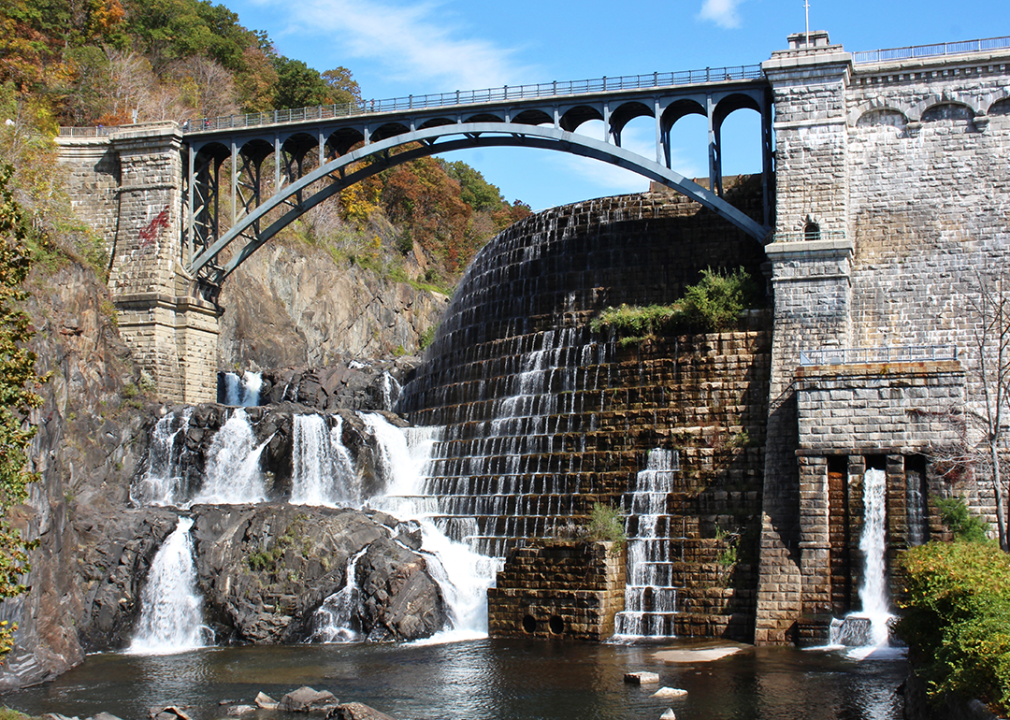
#24. New York
– Total high-hazard dams: 438 (2.2 per 100,000 residents)
– Share potentially dangerous: 37.7%
— Assessed to be an immediate threat: 1.4%
— Assessed to be in poor condition: 21.5%
— Condition withheld: 1.8%
— Not inspected: 13.0%
– Major examples (immediate threat): Toronto, Seneca Falls, Stillwell, Lake Jefferson
– Major examples (poor condition): Inghams Dam, Mill Brook Site 2 Dam, 60 Foot Dam, Deruyter Dam
Anthony George Visuals // Shutterstock
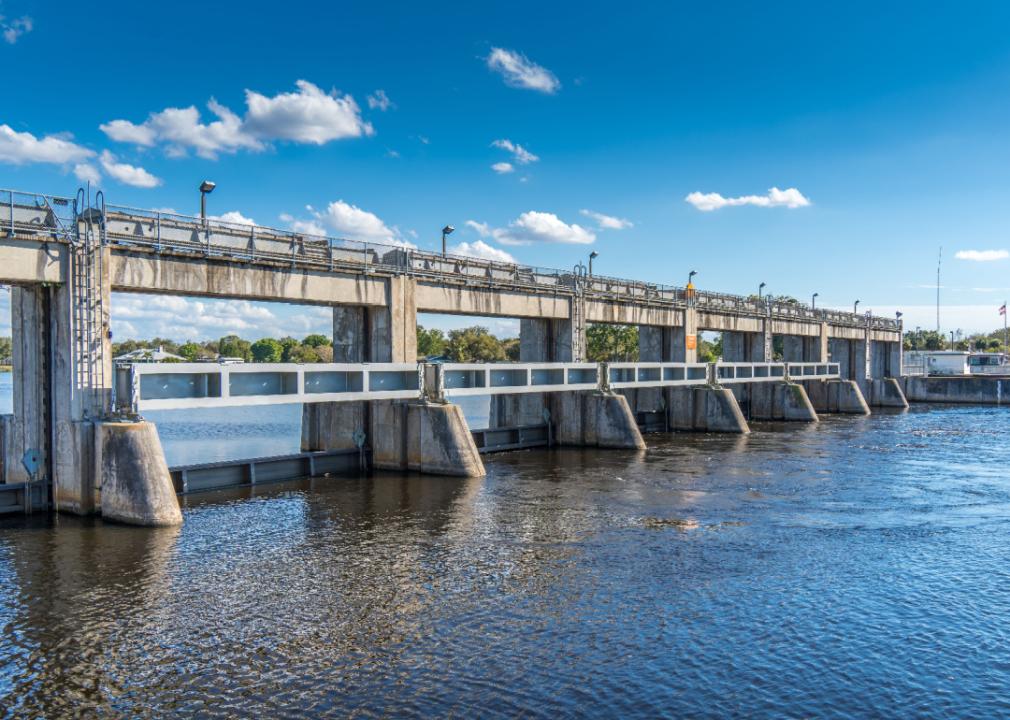
#23. Florida
– Total high-hazard dams: 94 (0.4 per 100,000 residents)
– Share potentially dangerous: 39.4%
— Assessed to be an immediate threat: 7.4%
— Assessed to be in poor condition: 3.2%
— Condition withheld: 3.2%
— Not inspected: 25.5%
– Major examples (immediate threat): Lake Asbury Dam, L.P.Hill Dam #3, L.P.Hill Dam 1, Herbert Hicks Dam 1
– Major examples (poor condition): Lake Asbury South Dam, Lake Ryan Dam, Meadow View Lake Dam
Ric Schafer // Shutterstock
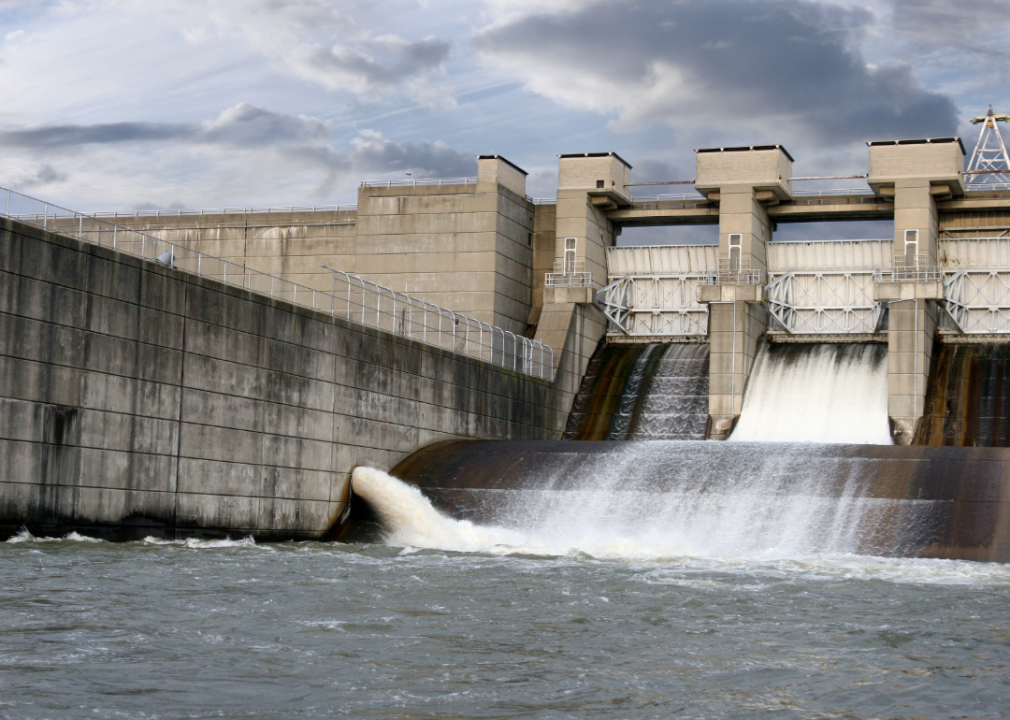
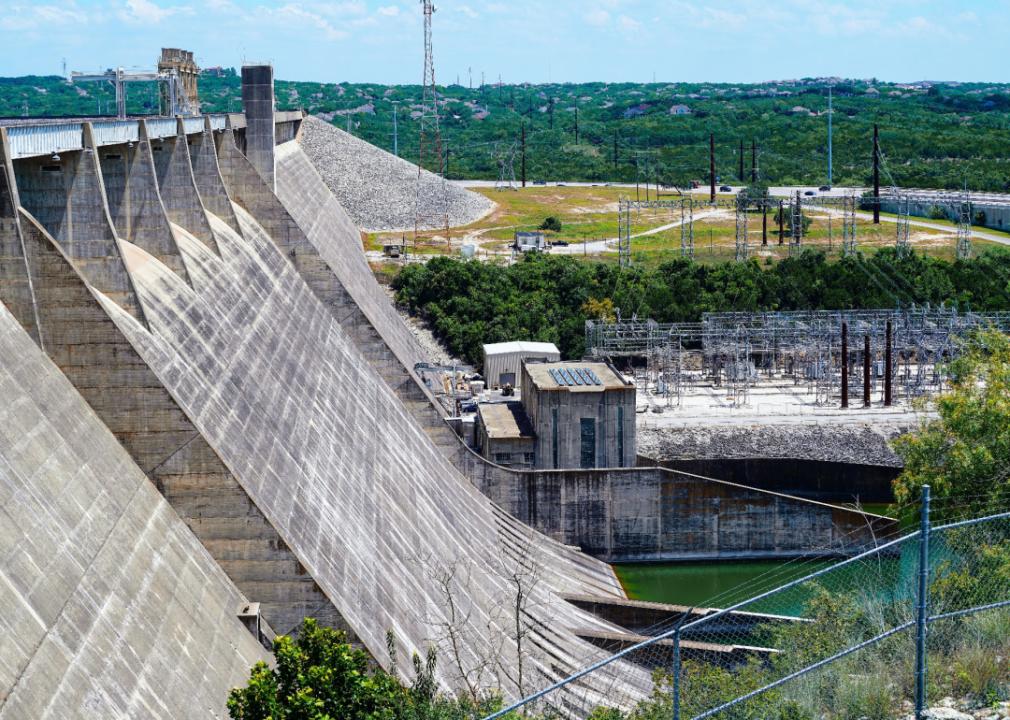
#22. Texas
– Total high-hazard dams: 1587 (5.3 per 100,000 residents)
– Share potentially dangerous: 43.5%
— Assessed to be an immediate threat: 5.8%
— Assessed to be in poor condition: 6.1%
— Condition withheld: 2.2%
— Not inspected: 29.4%
– Major examples (immediate threat): Williamson Dam, Chambers Creek WS SCS Site 42 Dam, Lake Comanche Dam, Hamilton City Lake Dam
– Major examples (poor condition): Amistad Dam, Robert Lee Dam, Sorrells Reservoir Dam, Livingston
Justin Wilkens // Shutterstock
#20. Mississippi
– Total high-hazard dams: 347 (11.8 per 100,000 residents)
– Share potentially dangerous: 43.8%
— Assessed to be an immediate threat: 17.0%
— Assessed to be in poor condition: 23.1%
— Condition withheld: 2.3%
— Not inspected: 1.4%
– Major examples (immediate threat): Indian Creek WS Str Y-9a-14 Dam, Lake Hilda, Big Sand Watershed Structure Y-32-11 Dam, Chuquatonchee WS Str 07 Dam
– Major examples (poor condition): Kelly Greenwood Lake Dam, Second Creek WS Str #6a Dam, Second Creek WS Str #7 Dam, Big Sand Watershed Structure Y-32-10 Dam
Wangkun Jia // Shutterstock
#20. New Hampshire
– Total high-hazard dams: 160 (11.5 per 100,000 residents)
– Share potentially dangerous: 43.8%
— Assessed to be an immediate threat: 0.0%
— Assessed to be in poor condition: 34.4%
— Condition withheld: 8.1%
— Not inspected: 1.3%
– Major examples (immediate threat): None
– Major examples (poor condition): Baker River Site 6a Dam, Baker River Site 5 Dam, Lake Gloriette Dike, Weare Reservoir Dam
Nicholas J Klein // Shutterstock
#19. Indiana
– Total high-hazard dams: 281 (4.1 per 100,000 residents)
– Share potentially dangerous: 44.1%
— Assessed to be an immediate threat: 0.7%
— Assessed to be in poor condition: 31.7%
— Condition withheld: 4.6%
— Not inspected: 7.1%
– Major examples (immediate threat): Upper Peoga Lake Dam, Log Cabin Lake Dam
– Major examples (poor condition): Eagle Creek Reservoir Dam, Twin-Rush Creek Dam #3, Hood Lake Dam, Delaney Creek Dam #1
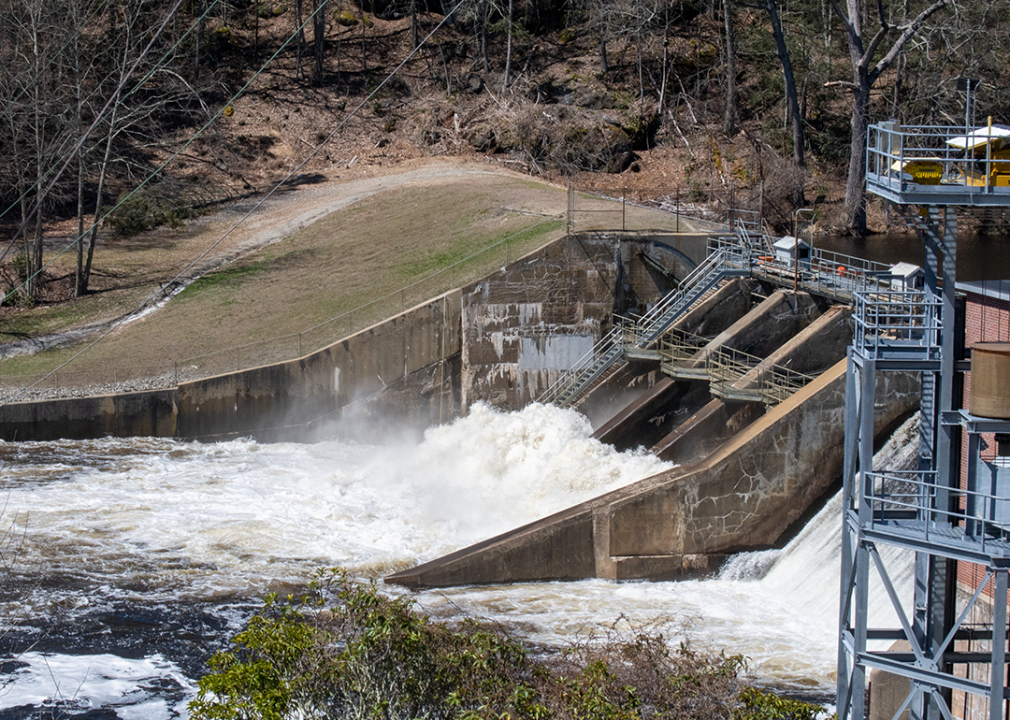
Williams Photography 365 // Shutterstock
#18. Georgia
– Total high-hazard dams: 542 (5.0 per 100,000 residents)
– Share potentially dangerous: 45.2%
— Assessed to be an immediate threat: 0.7%
— Assessed to be in poor condition: 36.3%
— Condition withheld: 4.2%
— Not inspected: 3.9%
– Major examples (immediate threat): Butler Reservoir, Cochran Lake Dam, Aug. Canal Left Embkmnt + Structures (Below + Bulkhead Structure), Gordon Lake
– Major examples (poor condition): Bartletts Ferry, Main Dam, Tallulah Falls, Tara Lake Dam, Talking Rock Creek WS Str #13
Kenneth Bradford // Shutterstock
#17. Ohio
– Total high-hazard dams: 425 (3.6 per 100,000 residents)
– Share potentially dangerous: 47.1%
— Assessed to be an immediate threat: 0.9%
— Assessed to be in poor condition: 30.6%
— Condition withheld: 13.9%
— Not inspected: 1.6%
– Major examples (immediate threat): Southern Silica Pond No. 1 Dam, Upper Shaker Lake Dam, Shreve Lake Dam, Blanchester Reservoir No. 4 Dam
– Major examples (poor condition): Marge Schott Lake Dam, Apple Valley Lake Dam, Barnesville Reservoir No. 3 Dam, Rocky Fork Lake Dam
Ian Kennedy // Shutterstock
#16. Arizona
– Total high-hazard dams: 162 (2.2 per 100,000 residents)
– Share potentially dangerous: 47.5%
— Assessed to be an immediate threat: 3.1%
— Assessed to be in poor condition: 6.8%
— Condition withheld: 34.0%
— Not inspected: 3.7%
– Major examples (immediate threat): Fredonia, Cook Reservoir, Green Road Basin, Maricopa Road Basin
– Major examples (poor condition): Frye Mesa, Jaques, Black Canyon, Fool Hollow
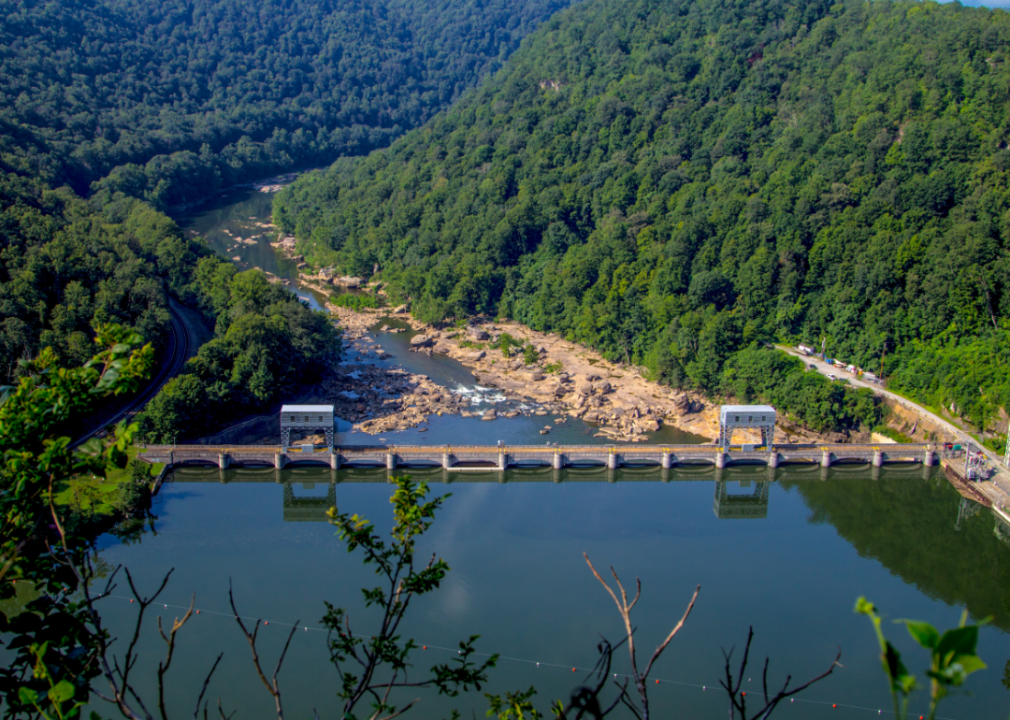
Canva
#15. West Virginia
– Total high-hazard dams: 419 (23.6 per 100,000 residents)
– Share potentially dangerous: 47.7%
— Assessed to be an immediate threat: 0.0%
— Assessed to be in poor condition: 6.7%
— Condition withheld: 11.9%
— Not inspected: 29.1%
– Major examples (immediate threat): None
– Major examples (poor condition): Horton Dam, Lake Stephens Dam, Elk Two Mile #14 Dam, Upper Smith Dam
Canva
#14. Montana
– Total high-hazard dams: 206 (18.3 per 100,000 residents)
– Share potentially dangerous: 48.1%
— Assessed to be an immediate threat: 0.5%
— Assessed to be in poor condition: 12.1%
— Condition withheld: 26.2%
— Not inspected: 9.2%
– Major examples (immediate threat): Melstone Detention Dam
– Major examples (poor condition): West Fork Bitterroot (Painted Rocks), Kootenai Dvlpmnt Impoundment Dam, Newlan Creek Dam, Willow Creek Dam
Canva
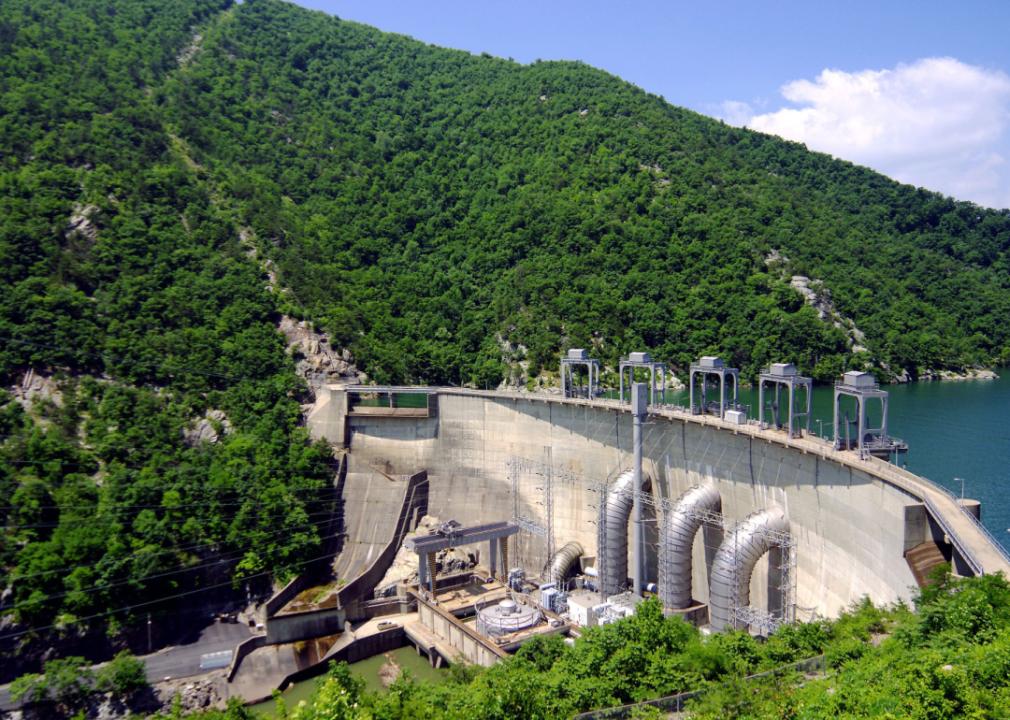
#13. Tennessee
– Total high-hazard dams: 274 (3.9 per 100,000 residents)
– Share potentially dangerous: 51.5%
— Assessed to be an immediate threat: 1.5%
— Assessed to be in poor condition: 0.4%
— Condition withheld: 20.4%
— Not inspected: 29.2%
– Major examples (immediate threat): Fall Creek Falls, Radnor, Leisure Lake, Pressmans Home
– Major examples (poor condition): Grundy #1
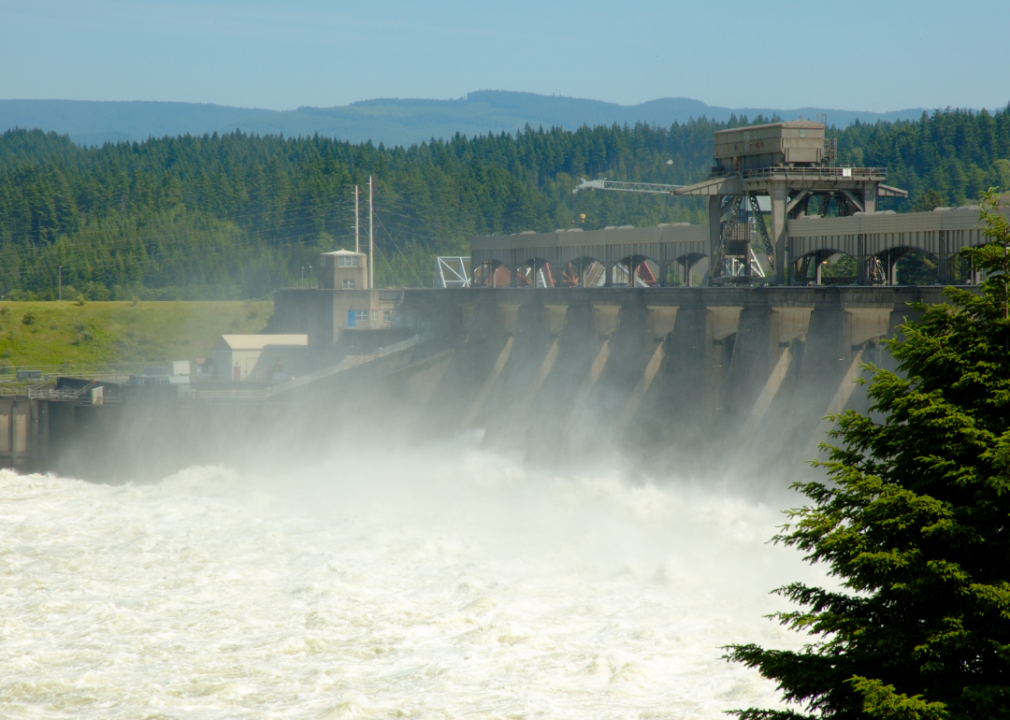
Canva
#12. Oregon
– Total high-hazard dams: 171 (4.0 per 100,000 residents)
– Share potentially dangerous: 55.6%
— Assessed to be an immediate threat: 7.0%
— Assessed to be in poor condition: 9.4%
— Condition withheld: 38.0%
— Not inspected: 1.2%
– Major examples (immediate threat): Smith, Hosler (Reeder Gulch, Clear Branch, Willow Creek 3 (Malheur)
– Major examples (poor condition): Bear Creek, Currant Creek, Mercer, Walch Dam
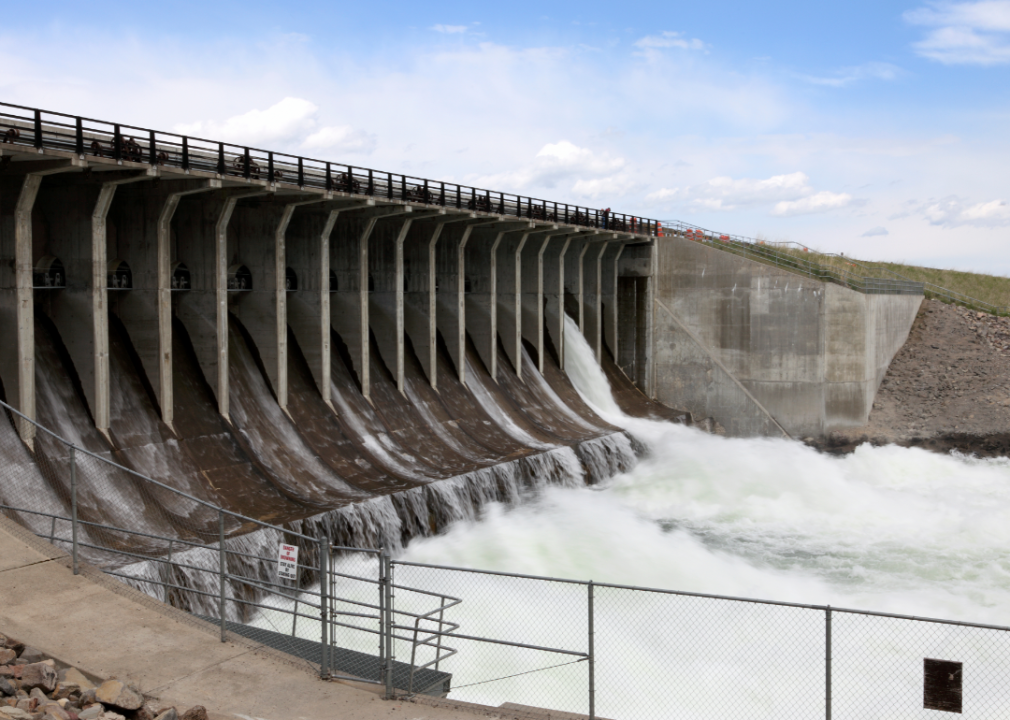
Canva
#11. Wyoming
– Total high-hazard dams: 108 (18.6 per 100,000 residents)
– Share potentially dangerous: 57.4%
— Assessed to be an immediate threat: 1.9%
— Assessed to be in poor condition: 12.0%
— Condition withheld: 25.9%
— Not inspected: 17.6%
– Major examples (immediate threat): Laprele, Snyder Creek Det Dam X
– Major examples (poor condition): Upper Van Tassell, Hawk Springs, Leavitt, Cardine Keith
Rick L. Saint John // Shutterstock
#10. South Dakota
– Total high-hazard dams: 88 (9.7 per 100,000 residents)
– Share potentially dangerous: 64.8%
— Assessed to be an immediate threat: 0.0%
— Assessed to be in poor condition: 15.9%
— Condition withheld: 36.4%
— Not inspected: 12.5%
– Major examples (immediate threat): None
– Major examples (poor condition): Marindahl, Richmond, Rank Dam, Lake Corsica Dam
Canva
#9. Kentucky
– Total high-hazard dams: 275 (6.1 per 100,000 residents)
– Share potentially dangerous: 65.5%
— Assessed to be an immediate threat: 4.0%
— Assessed to be in poor condition: 27.6%
— Condition withheld: 33.5%
— Not inspected: 0.4%
– Major examples (immediate threat): Rice Lake Dam, Elkhorn Lake Dam, Melvin Stinson Lake, Otter Lake Dam No 2
– Major examples (poor condition): Cranks Creek Lake Dam, Cedar Creek Dam, Willisburg Lake Dam, Red Lick Creek FRS 2
northlight // Shutterstock
#8. North Dakota
– Total high-hazard dams: 54 (6.9 per 100,000 residents)
– Share potentially dangerous: 66.7%
— Assessed to be an immediate threat: 0.0%
— Assessed to be in poor condition: 18.5%
— Condition withheld: 38.9%
— Not inspected: 9.3%
– Major examples (immediate threat): None
– Major examples (poor condition): Senator Young Dam, Matejcek Dam, Olson Dam, Bylin Dam
Canva
#7. New Mexico
– Total high-hazard dams: 222 (10.5 per 100,000 residents)
– Share potentially dangerous: 68.0%
— Assessed to be an immediate threat: 1.4%
— Assessed to be in poor condition: 45.5%
— Condition withheld: 20.7%
— Not inspected: 0.5%
– Major examples (immediate threat): San Mateo Lake Dam, Gardner Dam, Power Lake Dam
– Major examples (poor condition): Mcclure Dam, Lake Maloya Dam, T Or C Site 8c Dam, Nichols Dam
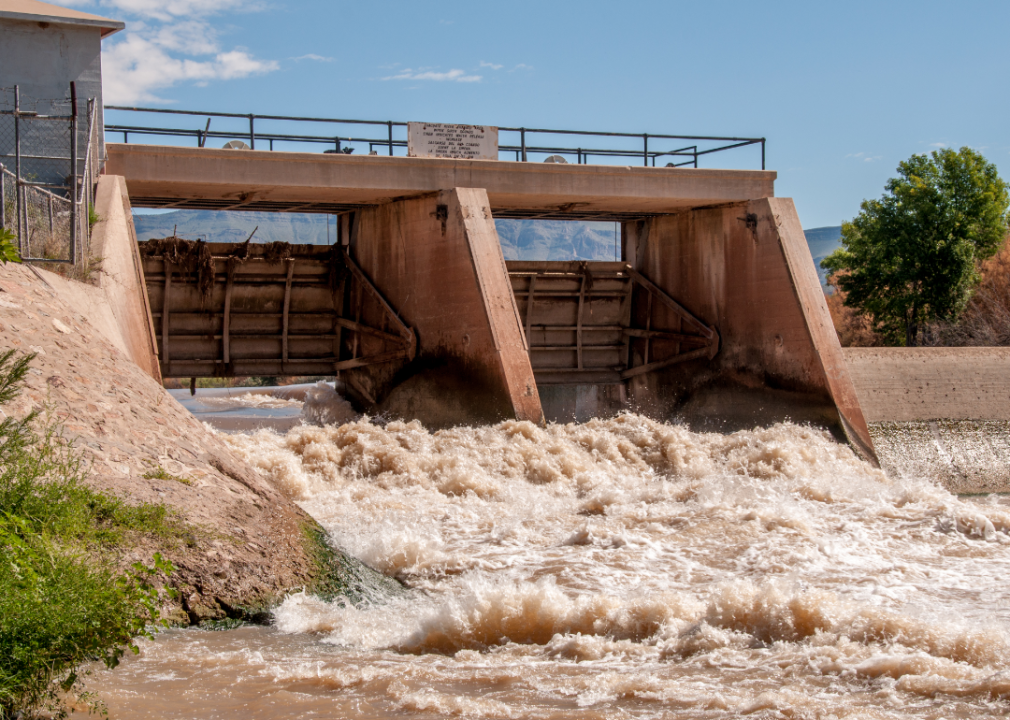
Gerlach Photos // Shutterstock
#6. Missouri
– Total high-hazard dams: 1493 (24.2 per 100,000 residents)
– Share potentially dangerous: 69.9%
— Assessed to be an immediate threat: 2.3%
— Assessed to be in poor condition: 0.1%
— Condition withheld: 0.9%
— Not inspected: 66.7%
– Major examples (immediate threat): Fletcher Tailings Dam, Gun Club Lake Dam, Upper Little Black D-2, Lake Waukomis Dam
– Major examples (poor condition): Sterling Hollow
Canva
#5. Rhode Island
– Total high-hazard dams: 95 (8.7 per 100,000 residents)
– Share potentially dangerous: 74.7%
— Assessed to be an immediate threat: 0.0%
— Assessed to be in poor condition: 55.8%
— Condition withheld: 0.0%
— Not inspected: 18.9%
– Major examples (immediate threat): None
– Major examples (poor condition): Gainer Memorial, Woonsocket Reservoir #1, Lawton Valley Reservoir, Harris Pond

Canva
#4. Hawaii
– Total high-hazard dams: 120 (8.3 per 100,000 residents)
– Share potentially dangerous: 77.5%
— Assessed to be an immediate threat: 12.5%
— Assessed to be in poor condition: 64.2%
— Condition withheld: 0.0%
— Not inspected: 0.8%
– Major examples (immediate threat): Puu Lua Reservoir, Ku Tree Reservoir, Wailuku Water Reservoir 10, Twin Reservoirs
– Major examples (poor condition): Wahiawa Dam, Horner Reservoir, Waikoloi Reservoir, Kahoma Reservoir
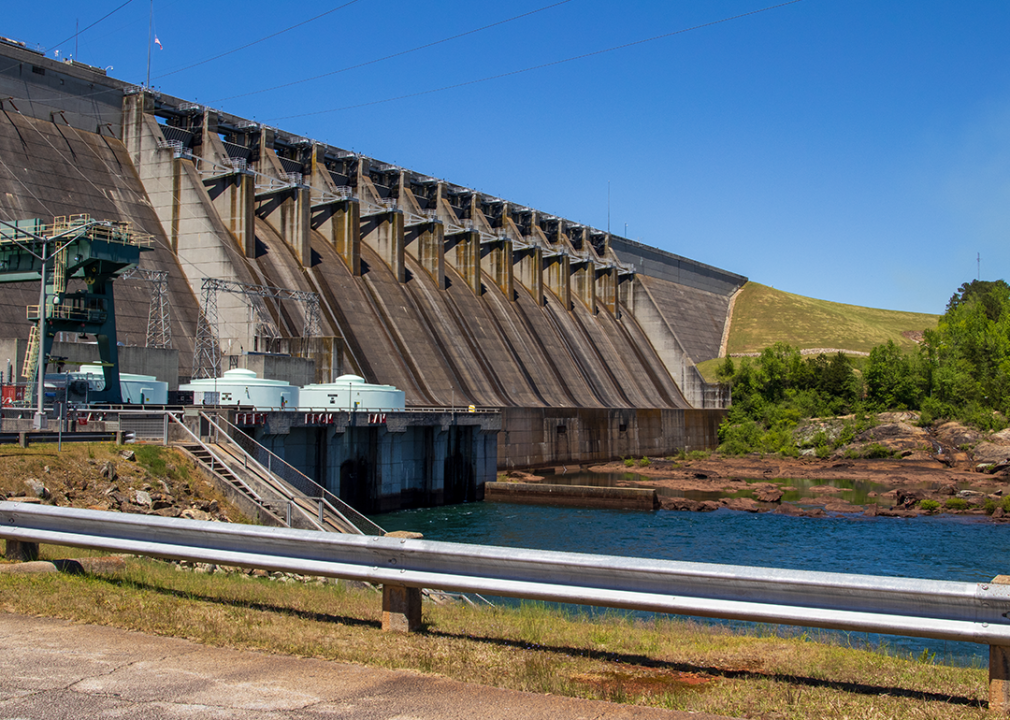
Canva
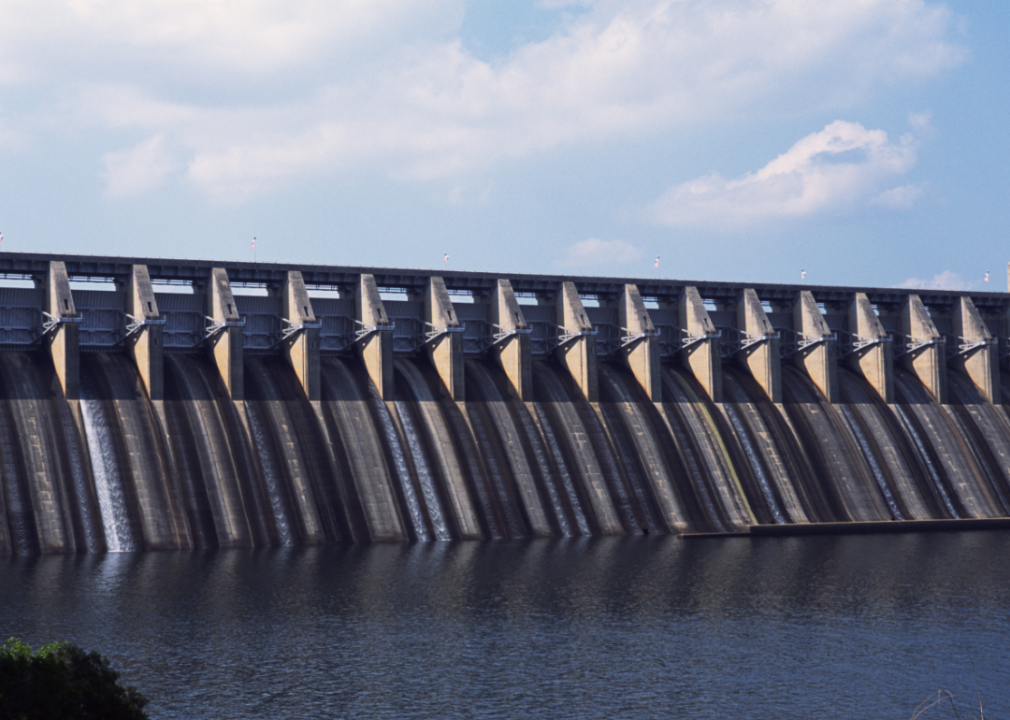
#3. Alabama
– Total high-hazard dams: 228 (4.5 per 100,000 residents)
– Share potentially dangerous: 89.9%
— Assessed to be an immediate threat: 0.4%
— Assessed to be in poor condition: 0.4%
— Condition withheld: 5.7%
— Not inspected: 83.3%
– Major examples (immediate threat): Cone Reservoir
– Major examples (poor condition): Logan Martin
Canva
#2. Arkansas
– Total high-hazard dams: 194 (6.4 per 100,000 residents)
– Share potentially dangerous: 98.5%
— Assessed to be an immediate threat: 0.0%
— Assessed to be in poor condition: 1.0%
— Condition withheld: 13.4%
— Not inspected: 84.0%
– Major examples (immediate threat): None
– Major examples (poor condition): Paris Dam, Broadmoor Lake Dam
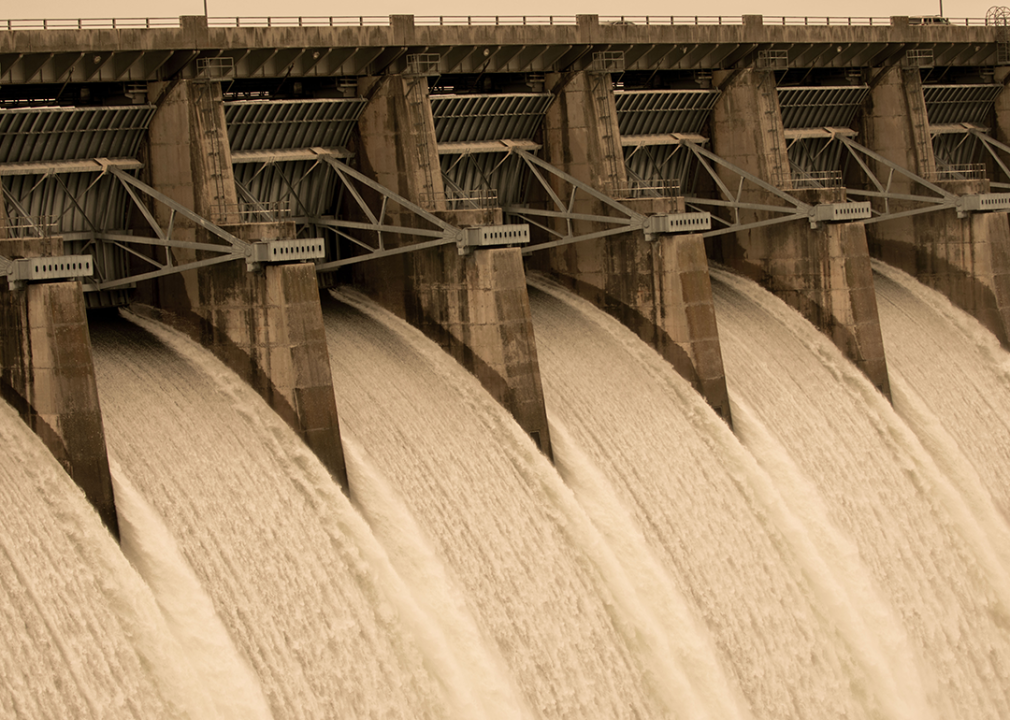
MShipphoto // Shutterstock
#1. Illinois
– Total high-hazard dams: 252 (2.0 per 100,000 residents)
– Share potentially dangerous: 98.8%
— Assessed to be an immediate threat: 0.0%
— Assessed to be in poor condition: 0.0%
— Condition withheld: 98.8%
— Not inspected: 0.0%
– Major examples (immediate threat): None
– Major examples (poor condition): None available
This story originally appeared on GetMyBoat and was produced and
distributed in partnership with Stacker Studio.


