How veterans’ employment compares to the rest of the population
When someone finishes their military service and returns to civilian life, their veteran status might go unnoticed. Unless you ask about their work history or background, you might not know that your co-worker, financial advisor, doctor, or neighbor served on active duty.
Nevertheless, veterans make up a significant part of the population, according to data from the Bureau of Labor Statistics. In 2021, 7% of the civilian noninstitutional population aged 18 and older—adults residing in the U.S. who aren’t active duty military personnel or inmates of institutions such as prisons or mental facilities—were veterans. The civilian labor force refers to anyone in the civilian noninstitutional population who is either employed or unemployed, including both veterans and nonveterans.
Once a veteran leaves the armed forces and reenters the labor force, how do their job prospects stack up to those of their nonveteran counterparts? To understand how veterans’ employment compares to the rest of the population, Stacker cited data from the BLS to create several visualizations.
The information from the report, published in 2021, was obtained from the monthly Current Population Survey of roughly 60,000 eligible households that provides data on employment, unemployment, and people not in the U.S. labor force. The CPS collects data about veterans monthly, and that data is the source of the 2021 annual averages provided by the BLS.
The 2021 data was also adjusted to incorporate population controls from the Department of Veterans Affairs’ new veteran population model. A 2021 survey programming error also neglected to ask veterans whose service ended prior to August 1964 about service-connected disabilities, so that data was gathered using information collected in the 2020 study.
Read on for a comparison of employment between veterans and nonveterans, which states have the highest unemployment rates for veterans, which industries attract the highest percentages of veterans, and more facts about veterans’ employment levels.
You may also like: Where every U.S. president went to college
![]()
Stacker
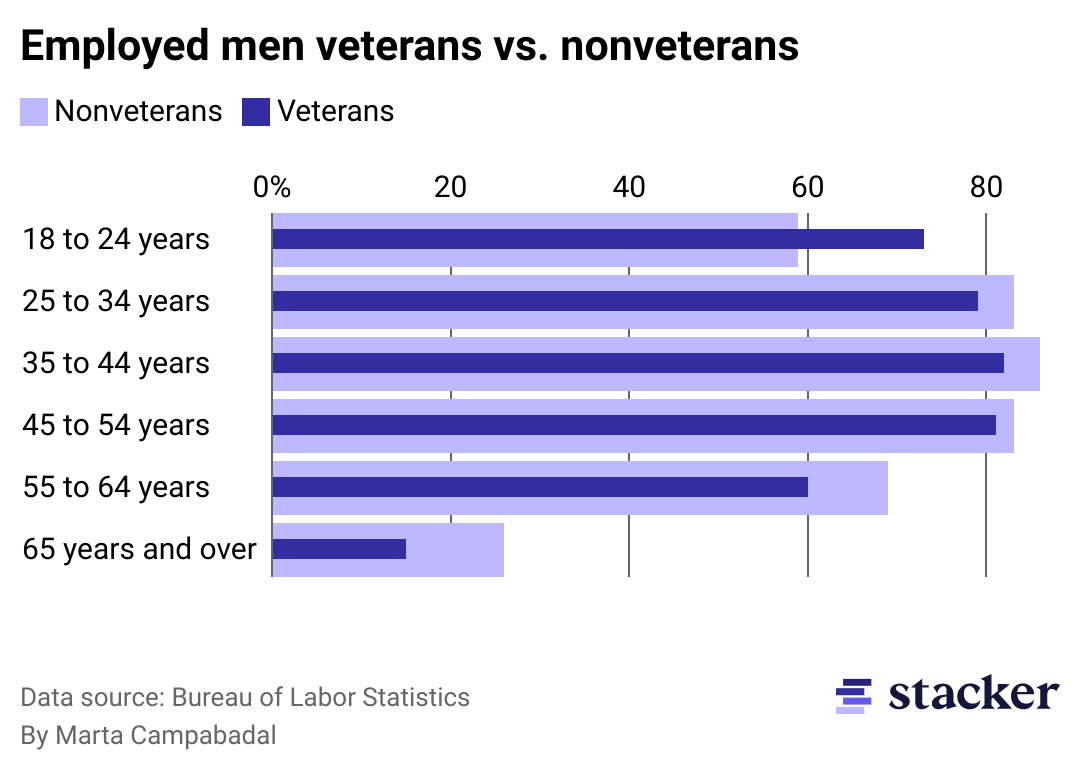
In 2021, the percentage of nonveteran men who were employed was higher than the percentage of employed veteran men
There’s no doubt that military service is a vastly different experience than many civilian careers—and the challenges of reentering the civilian workforce can be many. Overall, veterans’ employment rates were lower than nonveterans across all racial and ethnic demographics.
Research has shown that veterans cite finding a job as the biggest challenge of returning to civilian life. In 2021, 46% of veterans were employed, compared to 61% of nonveterans. For veteran men, the divide was even greater—44% of veteran men were employed versus 69% of nonveteran men. Notably, young male veterans have higher rates of employment than nonveterans, but as they grow older, their employment rates drop.
Stacker
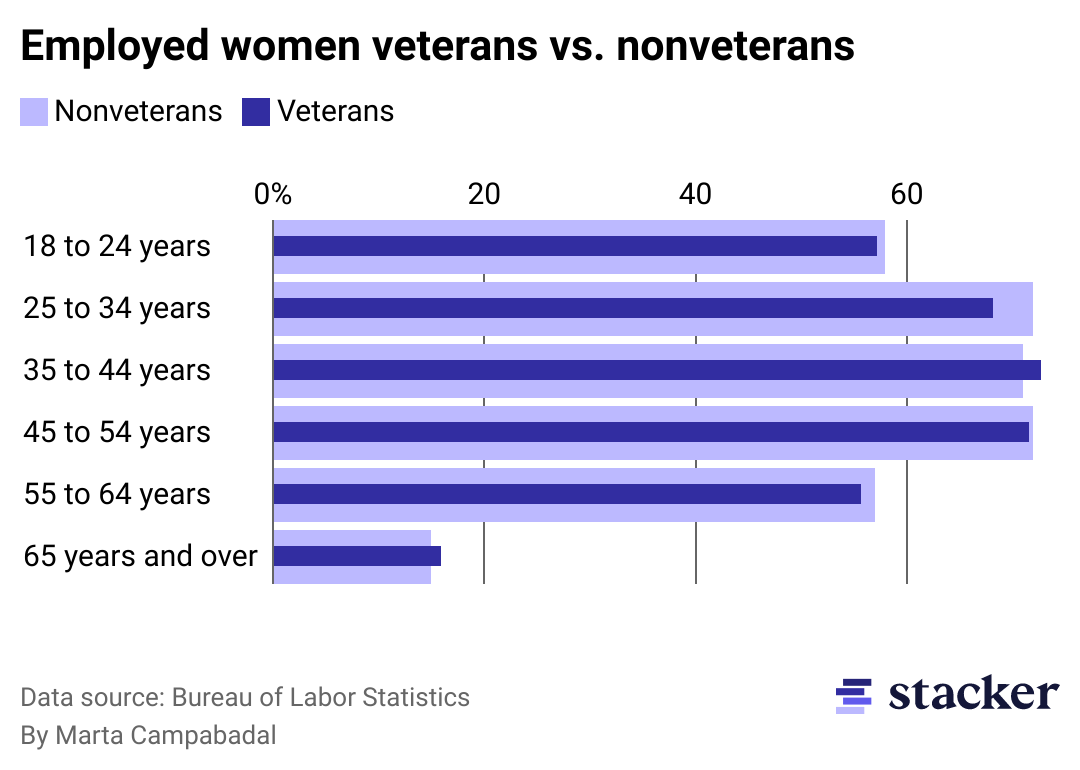
Unlike for men, employment rates among women veterans and nonveterans are similar
The numbers are more evenly split for women, as 54% of nonveteran women are employed, compared to 56% of veteran women. While employment rates for younger female veterans were slightly lower than the same group of nonveterans, rates for female veterans 35-44 were higher than their nonveteran counterparts. As they grow older, employment rates between women veterans and nonveterans are relatively similar.
Stacker
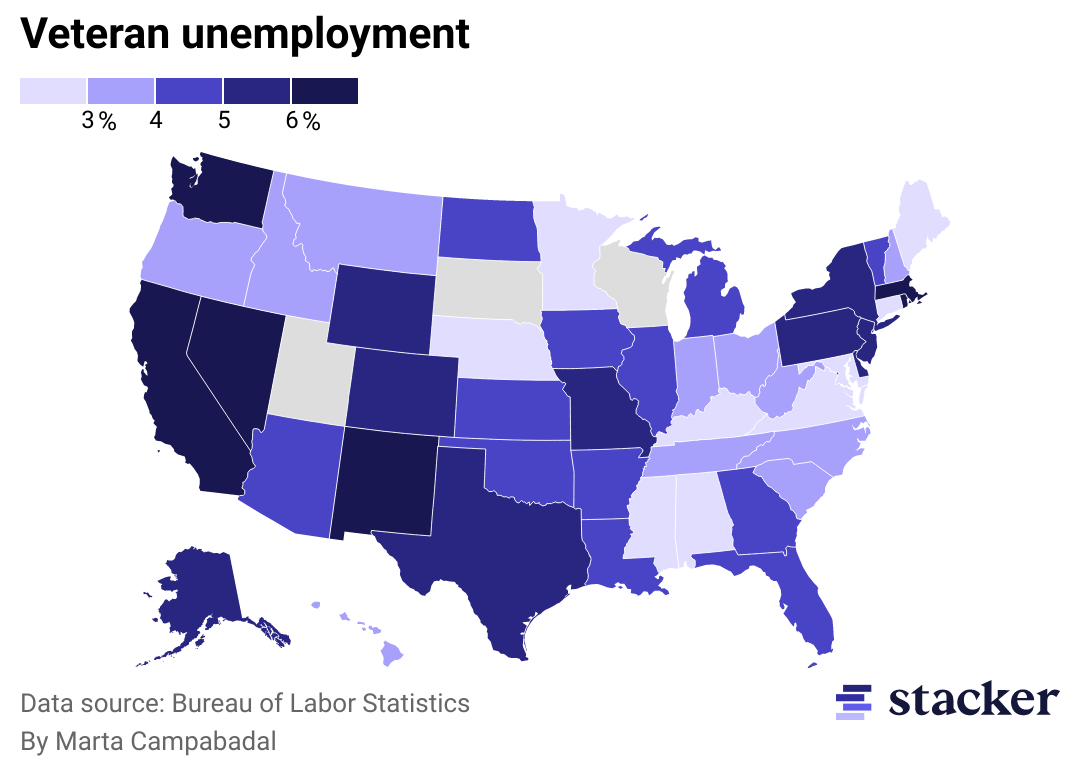
Washington and Nevada have the highest rates of unemployment among veterans
Taking into account that more than half of veterans are not in the labor force, the unemployment rate among veterans who are is pretty low. It varies quite a bit from state to state, ranging from 1.6% in Kentucky to 7.6% in Washington. This variation reflects the differences in the job markets and living conditions for veterans in different states.
A 2020 analysis conducted by personal finance site SmartAsset found that states with lower housing costs, high numbers of veterans, accessible Veterans Affairs health centers and benefits administration facilities, and low (or no) taxes on military pensions were friendlier to veterans. The report also considered additional factors such as the number and percentage of veteran-owned businesses. South Dakota, Wyoming, North Dakota, West Virginia, and Maine ranked as the five best states for veterans to live and work in 2020.
Stacker
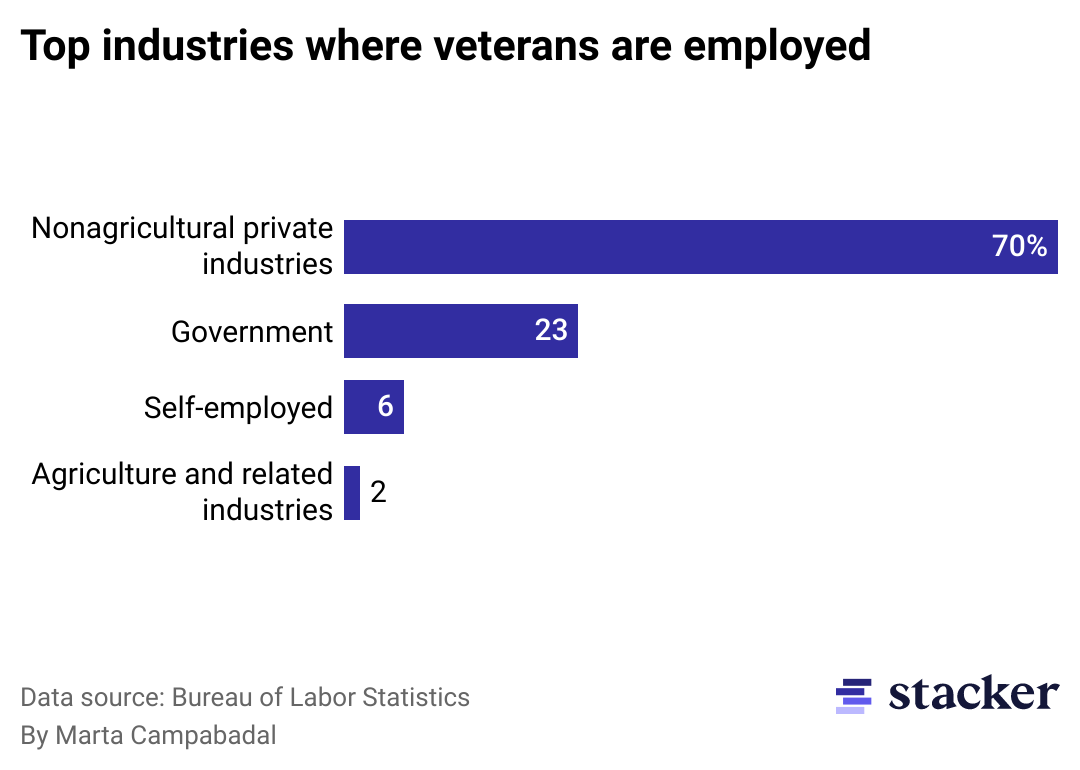
The majority of veterans work in nonagricultural private industries, particularly manufacturing, education, and health services
In 2021, most employed veterans worked in the private sector in nonagricultural industries, with manufacturing, professional and business services, and education and health services appearing in the report as the three most popular industries. About a quarter of employed veterans worked in government, primarily at the federal level. That’s a significant difference from the nonveteran population, as only 13.3% of nonveteran civilians in the labor force worked in government.
The report also revealed that veterans with a service-connected disability were more likely to work in the public sector than those with no disability: 27% versus 21%, respectively. About 4.9 million veterans—or 27% of the total population—reported service-connected disabilities.