The stock market’s recent volatility is making countless people seasick. Many investors are wondering if they should hoist the sails to catch the next rally or batten down the hatches to prepare for a storm. For some perspective on the market’s gyrations, one should keep an eye on these two indicators courtesy of analysts at Elliott Wave International, the world’s largest independent technical analysis firm.
Elliott Wave International’s experts watch and forecast the markets around the clock. The firm recently released a video that showcases 28 indicators that together give a clear, birds-eye view of the conditions surrounding the market’s action. Two of the indicators are covered in this article, but readers can check out the rest by watching the full video on the firm’s website (free sign-up required).
Low Craving for Cash: When investors are seeing blue skies only, they jettison cash and load up on stocks. When they’re seeing clouds on the horizon, they perceive cash as a safe haven. And that is what they are doing today.
The chart shows the S&P 500 (top line) plotted against the retail money market ratio as a percentage of the S&P’s market capitalization (bottom line). The money market ratio gives an indication of the public’s desire for cash relative to the value of stocks. The ratio spiked to over 12% in 2009 as the S&P got cut in half during the financial crisis. Stocks bad, cash good.
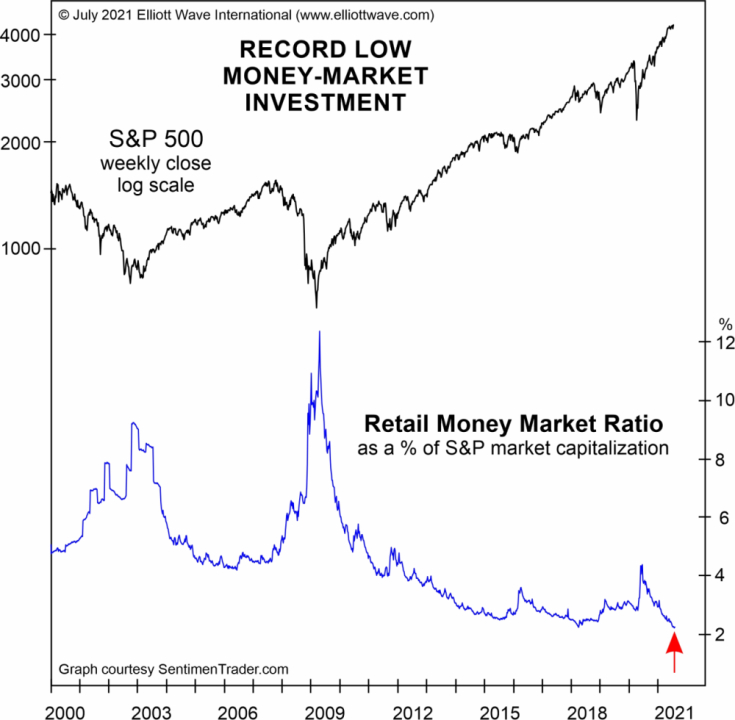
Today, everyone is seeing the opposite scenario. With lofty heights in the stock market, the retail money market ratio recently made a record low near 2%. Stocks good, cash bad. The major question is if that will last.
Even the Bears are Bullish: Another way to get a read on stock market sentiment is to look at where money managers are putting assets. In a major bear market, the most bearish managers are typically leveraged short, meaning that they’re borrowing money to bet on falling stock prices. At a major peak, the most bearish managers might nevertheless have most of their assets invested long in the market.
According to a recent reading, even the most bearish managers nowadays are still upwards of 70% long. The reader should pause and let that sink in. That means even the most pessimistic managers have put more than two-thirds of their assets into bets on rising stock prices. The important question to ask is if that will last. An eye must be kept on this measure.
Readers can check out 26 more indicators that can help one understand the markets by watching a special video presentation on the Elliott Wave International website at the following link: https://www.elliottwave.com/en/Video/A-Stock-Market-Top-for-the-Ages/Resource?g=pr.
###
For more information about Elliott Wave International, contact the company here:
Elliott Wave International
Dave Allman
800-336-1618
media@elliottwave.com
PO Box 1618
Gainesville GA 30503
USA